Fig. 2.

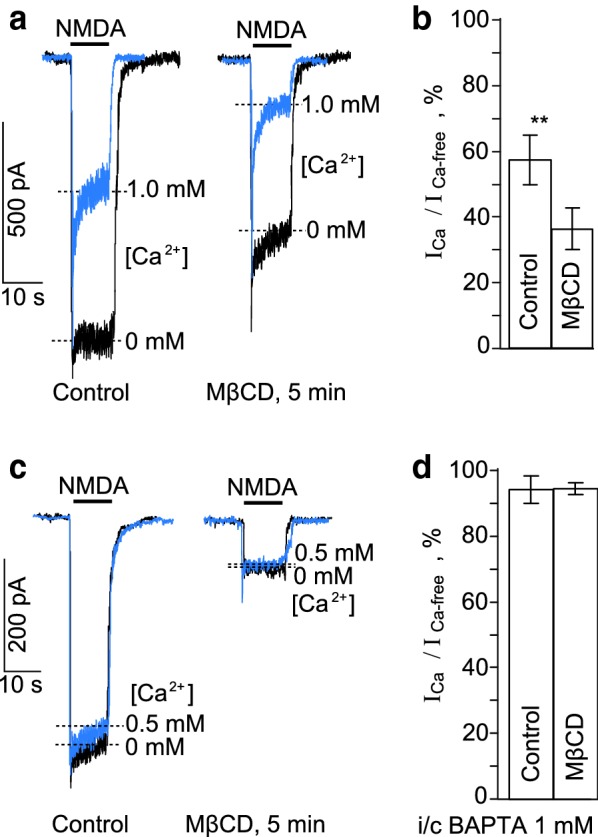
Effects of the cholesterol extraction on NMDAR currents. a Currents activated by 100 μM NMDA + 10 μM Gly recorded in the same neuron at − 55 mV in the nominal absence of Ca2+ and presence of 1 mM Ca2+ in the bathing solution before (Control) and after the cholesterol extraction with 1.5 mM MβCD (MβCD, 5 min). Overlays of currents are presented for the better comparison of their kinetics. b Comparison of NMDAR Ca2+-dependent desensitization before (Control) and after the cholesterol extraction (MβCD). On the histogram the amplitude ratio of currents recorded in the presence of 1 mM Ca2+ (ICa) and the absence of Ca2+ (ICa-free) in the external solution measured at the steady state (mean values ± S.E.M. for each of the conditions, n = 6). ** the value is significantly different for the corresponding value obtained after the cholesterol extraction (MβCD, p < 0.007, Student’s two-tailed t-test). c Currents activated by 100 μM NMDA + 10 μM Gly recorded in the same neuron at − 55 mV in the nominal absence of Ca2+ and presence of 0.5 mM Ca2+ in the bathing solution using the 1 mM BAPTA- containing intrapipette solution before (Control) and after the cholesterol extraction with 1.5 mM MβCD (MβCD, 5 min). Overlays of currents are presented for the better comparison of their kinetics. d Comparison of the NMDAR Ca2+-dependent desensitization of currents recorded using the 1 mM BAPTA-containing intrapipette solution before (Control) and after the cholesterol extraction (MβCD). On the histogram the amplitude ratio of currents recorded in the presence of 0.5 mM Ca2+ (ICa) and the absence of Ca2+ (ICa-free) in the external solution measured at the steady state (mean values ± S.E.M. for each of the conditions, n = 6)
