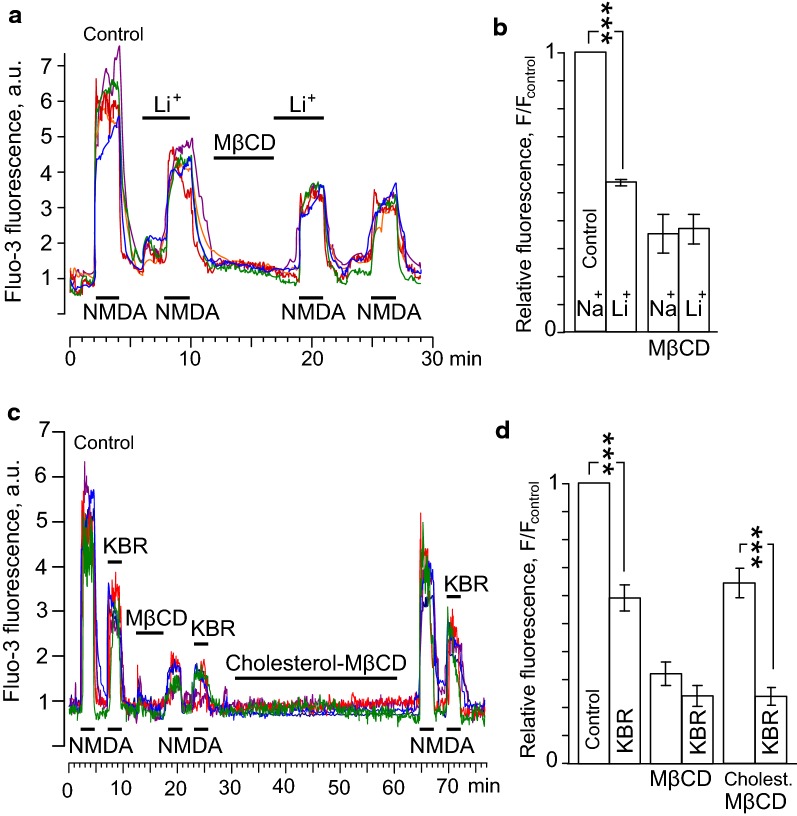
Fig. 3.
Effects of the cholesterol extraction and loading on Ca2+ responses induced by NMDA. a Neuronal Ca2+ responses evoked by 100 μM NMDA + 10 μM Gly in the 140 mM Na+-containing (Control) and 140 mM Li+-containing external solutions before and after the cholesterol extraction. Applications of 100 μM NMDA + 10 μM Gly, 140 mM Li+ and 1.5 mM MβCD are indicated by bars. Examples of Ca2+ responses of 4 neurons are shown. b The histogram represents the ratio of squares of Ca2+ responses to the square of Ca2+ response obtained under control (140 mM Na+-containing external solution). Mean values ± S.E.M. for each of the conditions (overall 98 neurons, n = 3) are plotted. *** the value is significantly different from other data (p < 0.0001, one-way paired ANOVA, Bonferroni post hoc test). c Neuronal Ca2+ responses recorded in 140 mM Na+-containing external solution evoked by 100 μM NMDA + 10 μM Gly (Control) and 100 μM NMDA + 10 μM Gly + 10 μM KB-R7943 (KBR) before cholesterol extraction, after cholesterol depletion with MβCD and then after cholesterol restoration with cholesterol-MβCD. Applications of 100 μM NMDA + 10 μM Gly, 10 μM KB-R7943, 1.5 mM MβCD and 1.5 mM cholesterol-MβCD are indicated by bars. Examples of Ca2+ responses of 6 neurons are shown. d The histogram represents the ratio of squares of Ca2+ responses to the square of Ca2+ response obtained under control (NMDA). Mean values ± S.E.M. for each of the conditions (overall 91 neurons, n = 3) are plotted. *** the value is significantly different from other data (p < 0.0001, one-way paired ANOVA, Bonferroni post hoc test)

