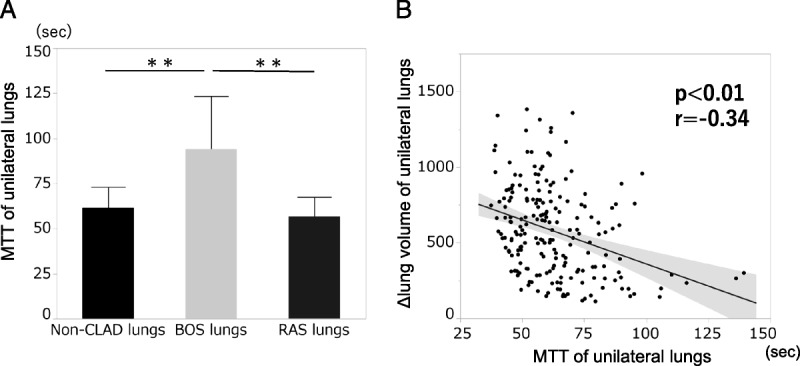
FIGURE 4.

A, MTT of unilateral lungs divided into the 3 groups, non-CLAD lungs, BOS lungs, and RAS lungs. B, Correlation analysis between Δlung volume of unilateral lungs and MTT of unilateral lungs. Bars and error bars show mean and standard deviation; *P < 0.05, **P < 0.01. r: correlation coefficient.
