
FIGURE 2.
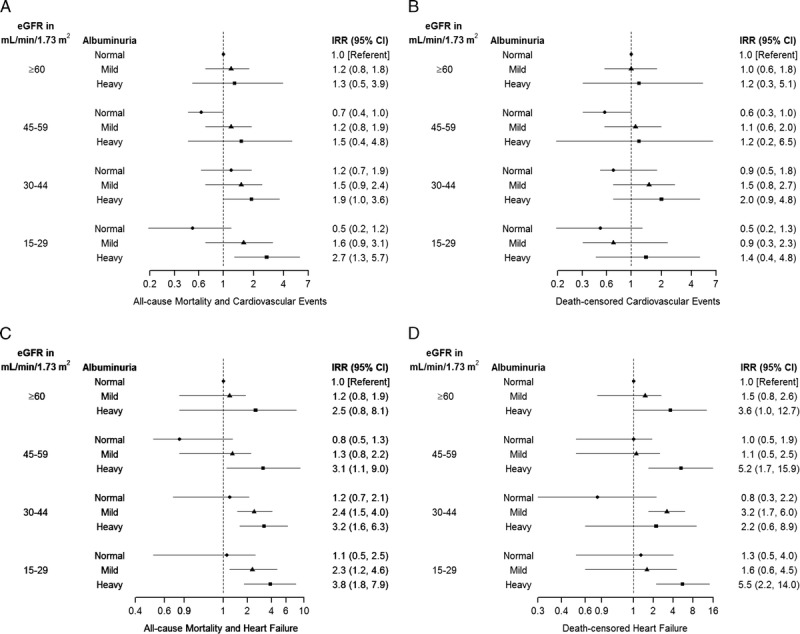
Adjusted Incidence rate ratios by Level of eGFR and Albuminuria in Kidney Transplant Recipients. All values ≥1, including point estimates and confidence limits, are plotted on log scale. All values <1 are plotted on −(1/3*x) scale for outcomes of all-cause mortality and cardiovascular events and death-censored cardiovascular events, and are plotted on −(1/x) scale for outcomes of all-cause mortality and heart failure and death-censored heart failure. IRR, incidence rate ratio.