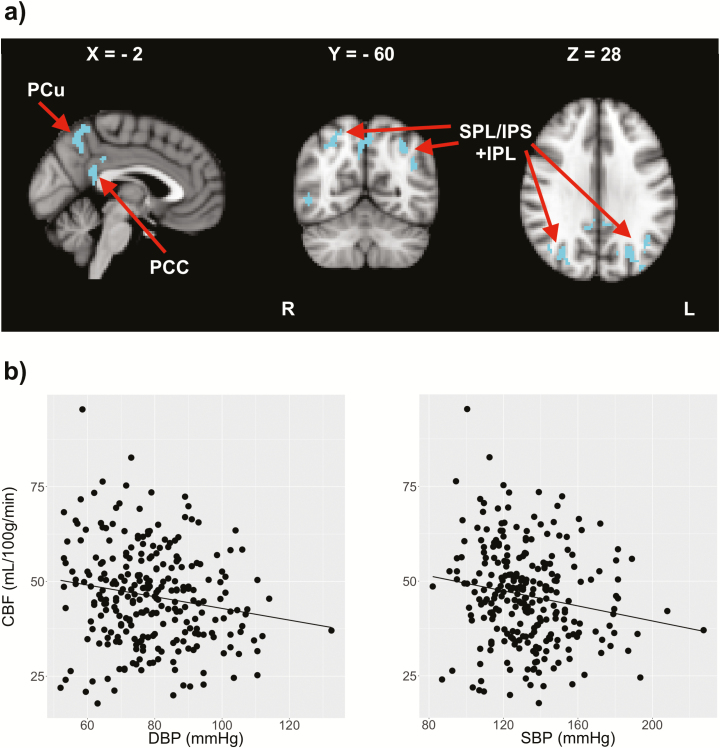
Figure 4.
Voxel-wise CBF comparison between MCI patients and controls. (a) The clusters show areas with reduced CBF in the MCI group compared with controls. The coordinates are also shown in MNI template. (b) Changes in mean CBF within the same voxels with DBP (β = −0.17, P = 0.005) and SBP (β = −0.09, P = 0.120).Abbreviations: CBF, cerebral blood flow; DBP, diastolic blood pressure; IPL, inferior parietal lobule; IPS, intraparietal sulcus; MCI, mild cognitive impairment; MNI, Montreal Neurological Institute; PCC, posterior cingulate cortex; Pcu, precuneus; SBP, systolic blood pressure; SPL, superior parietal lobule.

