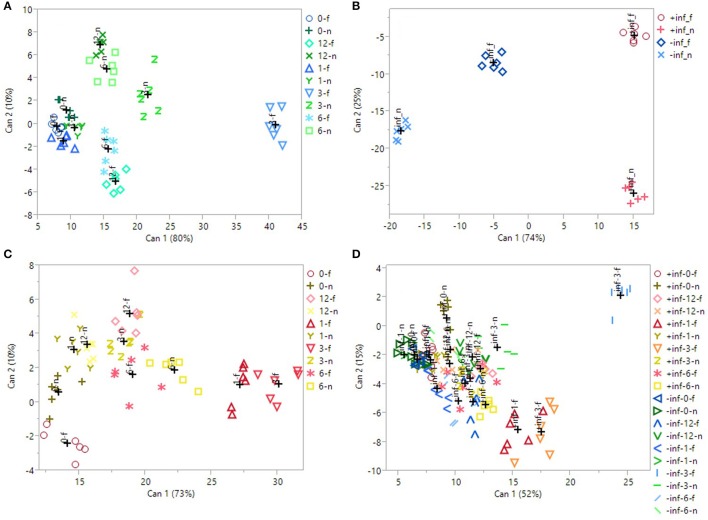
Figure 2.
2D scatterplot of canonical discriminant analysis considering (A) the uninfected, UV-B-treated samples; (B) the UV-B-untreated samples; (C) the infected, UV-B-treated samples; (D) all the samples. In (A,C), 0/1/3/6/12_f/n refers to the samples irradiated with UV-B for 0/1/3/6/12 h, considering the region far/near the inoculation point. In (B), ±inf_f/n refers to the infected/uninfected samples, considering the region far/near the inoculation point. In (D), ±inf_0/1/3/6/12_f/n refers to the infected/uninfected samples, irradiated with UV-B for 0/1/3/6/12 h, considering the region far/near the inoculation point. Can 1 and 2 refers to the canonical function 1 and 2, which considers all the variables in order to maximize the separation among the groups.

