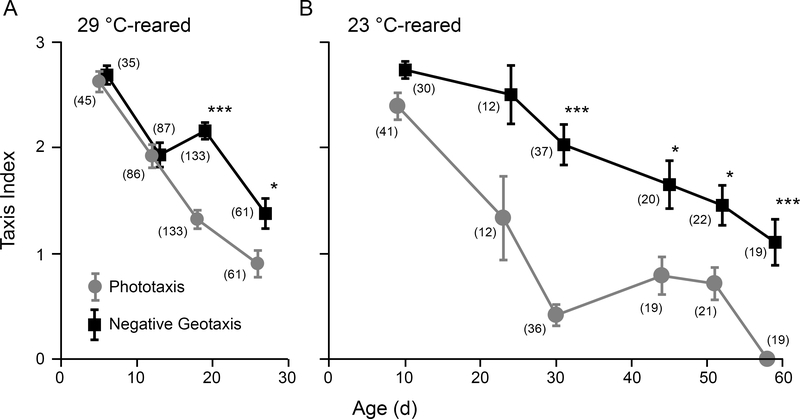
Figure 1.
Distinct progression of age-dependent decline in phototaxis and negative geotaxis.
(A) 29 °C-reared individuals. (B) 23 °C-reared individuals. Points represent the mean photo-/geo-taxis index for WT flies. Error bars indicate SEM. (* p < 0.05, *** p < 0.001, Kruskal-Wallis ANOVA, Bonferroni-corrected rank-sum post hoc test. n = 7 – 40 flies per run, 2 – 4 runs per age, number of total flies per age group as indicated in parentheses)

