
Figure 2. Multiple biomarkers and mortality after surgical aortic valve replacement.
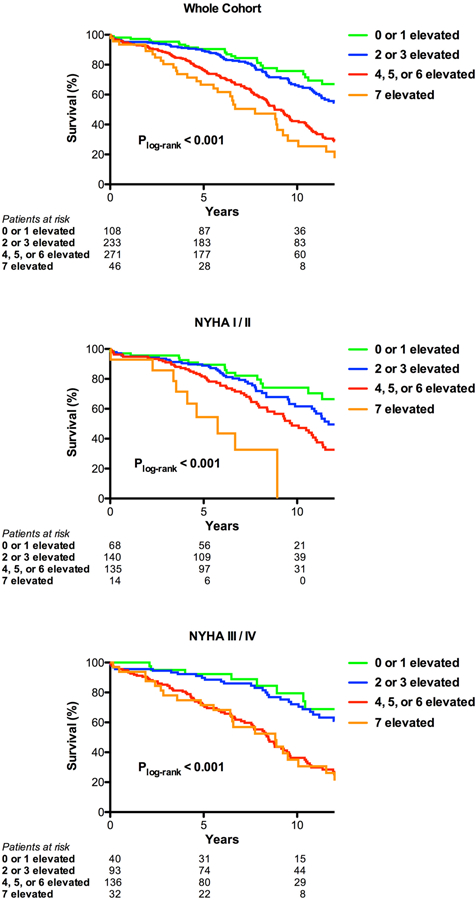
Kaplan-Meier curves are shown for number of biomarkers elevated (0–1, 2–3, 4–6, or 7) for patients treated with surgical aortic valve replacement. Curves are shown for all patients (a), those with NYHA I/II (b), and those with NYHA III/IV (c).