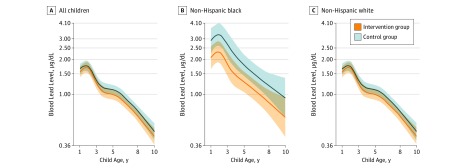
Figure 3. Geometric Mean Childhood Blood Lead Concentrations Between 1 and 8 Years of Age Stratified by Race/Ethnicity .
Blood lead concentrations were measured in venous whole-blood samples collected from children at 1, 2, 3, 4, 5, and 8 years of age. There were 315 total children (1165 repeated measures), 226 children born to non-Hispanic white women (843 repeats), and 69 children born to non-Hispanic black women (255 repeats). No significant differences were found in blood lead concentrations across the intervention and control arms among all children (P = .20). Among children of non-Hispanic black women, levels were significantly lower in the intervention group than in the control group (P = .02), but no significant differences were found in the children of non-Hispanic white women (P = .29; intervention × race/ethnicity P = .03). Age-specific geometric mean blood lead concentrations were derived from a mixed model that included intervention arm, a 5-knot restricted cubic polynomial spline for age, and intervention × age interaction terms. Shading indicates 95% CIs. Blood lead level is reported in micrograms per deciliter (to convert to micromoles per liter, multiply by 0.0483).

