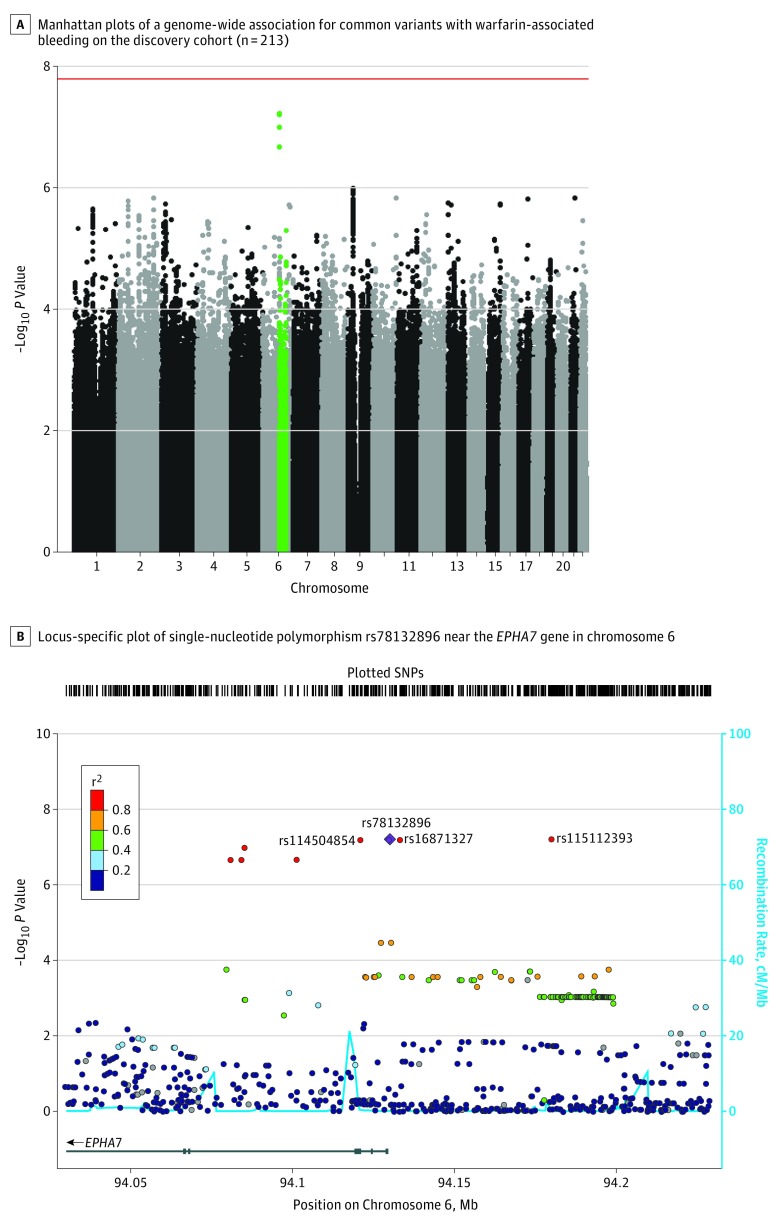
Figure. Single-Nucleotide Polymorphisms Associated With Bleeding Risk in the African American Discovery Cohort.
A, Single-nucleotide polymorphisms (SNPs) are plotted on the x-axis according to their positions on each chromosome against association with warfarin-associated bleeding on the y-axis (−log10 P value). The red line shows genome-wide significant threshold of P = 1.62 x 10⁻⁸. Green points toward the top of graph indicate the near-significant association found in chromosome 6.
B, The colors of the circles denote linkage disequilibrium (r2) between rs78132896 (purple diamond) and nearby SNPs (based on pairwise r2 values from the 1000 Genomes Project African population). The 3 near-significant SNPs in high linkage disequilibrium with rs78132896 are shown. The blue line and right y-axis show the estimated recombination rate (obtained from HapMap). The x-axis represents the genomic position in chromosome 6 and the left y-axis represents the –log10 P of association with warfarin-related bleeding in the discovery cohort (n = 215). Genes at this locus are indicated in the lower panel of the plot. Chromosomal positions are based on hg19 genome build.

