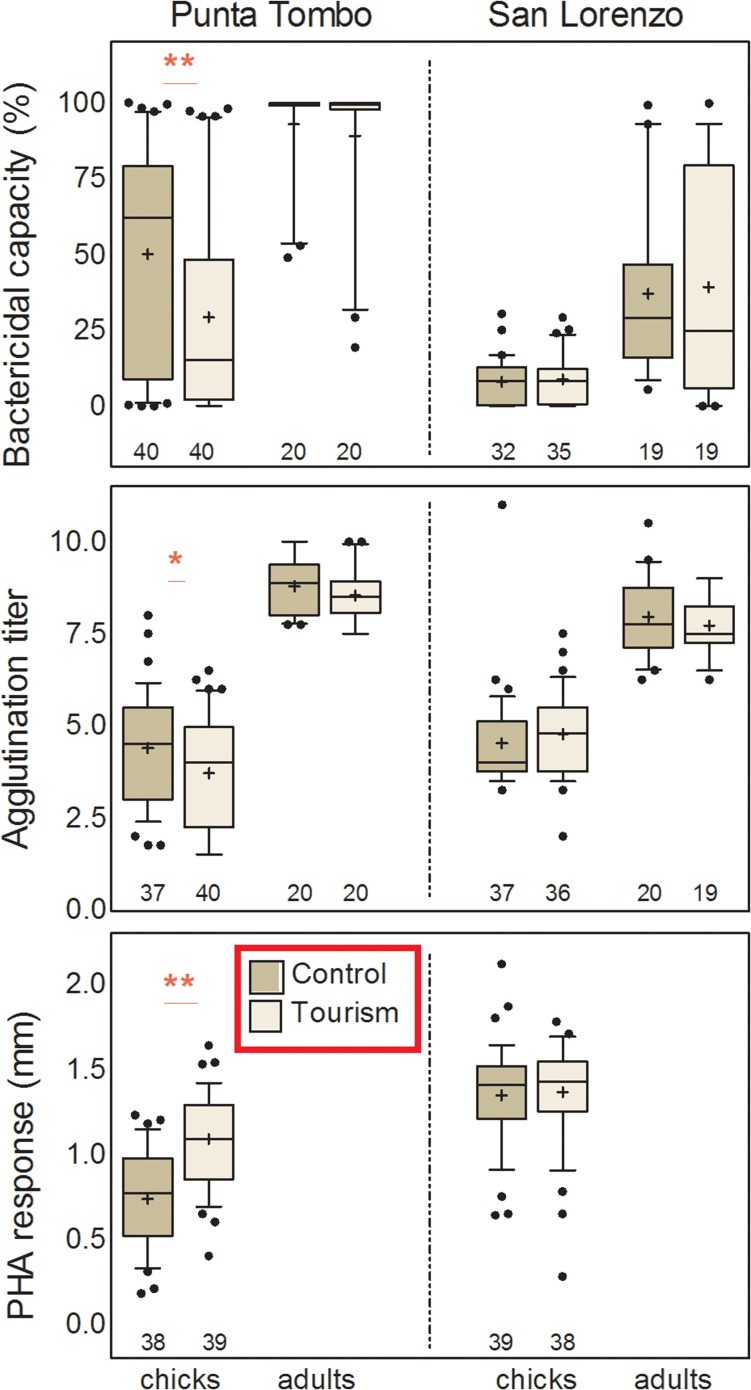
Figure 4:
Box plots for immune parameters of adult and chick Magellanic penguins at tourist-visited (Tourism) and non-visited (Control) sites at the two study colonies, Punta Tombo (left) and San Lorenzo (right). Box plots depict medians (horizontal lines inside boxes), means (crosses inside boxes), 25 and 75 percentiles (edges of boxes), 10 and 90 percentiles (whiskers) and outlying points included in the analyses (dots). Sample sizes are depicted below each box. Asterisks highlight the effect of site within each age group: ** = P < 0.05, * = P < 0.1.

