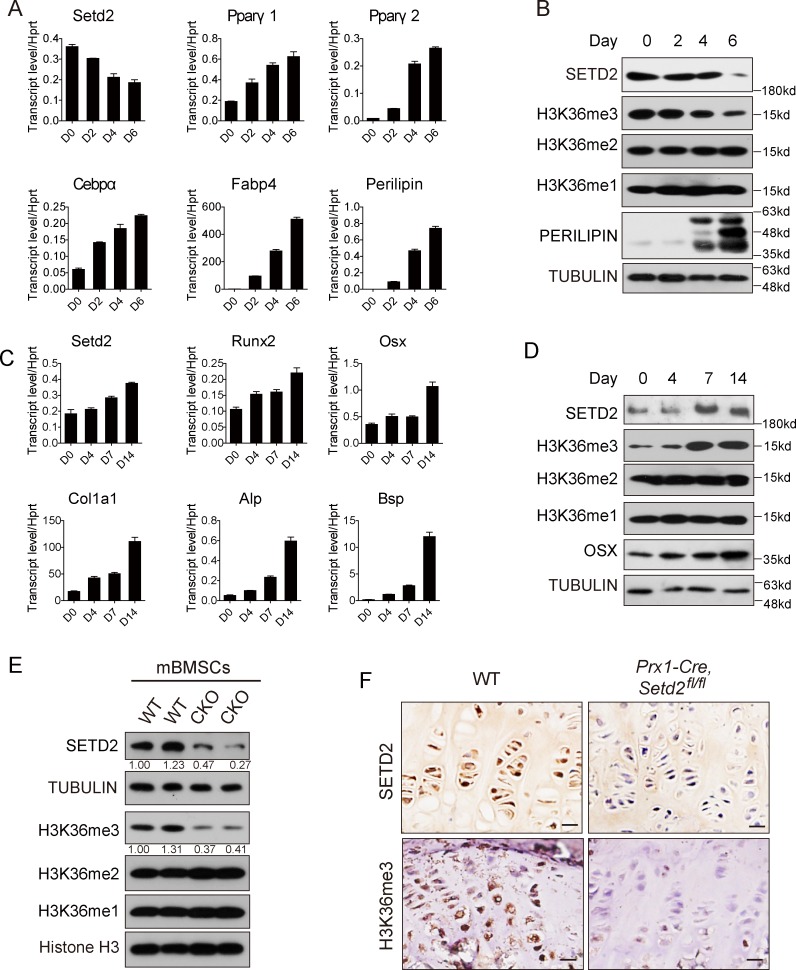
Fig 1. H3K36me3 changed accordingly with SETD2 level during BMSC adipogenesis and osteogenesis.
(A) qPCR analysis of Setd2 and adipocyte markers including Pparγ1, Pparγ2, Cebpα, Fabp4, and Perilipin expression in BMSCs during adipogenesis for indicated days. Data represent mean ± SD, n = 4. (B) Western blot analysis of SETD2, PERILIPIN, and H3K36me1/2/3 level during adipogenesis for different days. (C) qPCR analysis of Setd2 and osteoblast markers including Runx2, Osx, Col1α1, Alp, and Bsp expression during osteogenesis for different days. Data represent mean ± SD, n = 4. (D) Western blot analysis of SETD2, OSX, and H3K36me1/2/3 level in BMSCs during osteogenesis for indicated days. (E) Western blot analysis of SETD2 and H3K36me1/2/3 level in BMSCs isolated from WT and Prx1-Cre, Setd2fl/fl mice. (F) Immunohistochemistry assay of SETD2 and H3K36me3 level in hindlimb growth plate of Prx1-Cre, Setd2fl/fl mice and WT control mice. Images are representative results from 3 independent experiments. Scale bar = 20 μm. Data used in the generation of this figure can be found in S1 Data. Alp, alkaline phosphatase; BMSC, bone marrow mesenchymal stem cell; Bsp, bone sialoprotein; Cebpα, CCAAT enhancer binding protein α; Col1α1, Collagen type 1 alpha 1; Fabp4, fatty acid binding protein 4; H3K36me3, H3 lysine 36 trimethylation; Osx, Sp7 transcription factor; Pparγ1/2, peroxisome proliferative activated receptor γ1/2; qPCR, quantitative PCR; Runx2, runt-related transcription factor 2; SETD2, SET-domain-containing 2; WT, wild-type.

