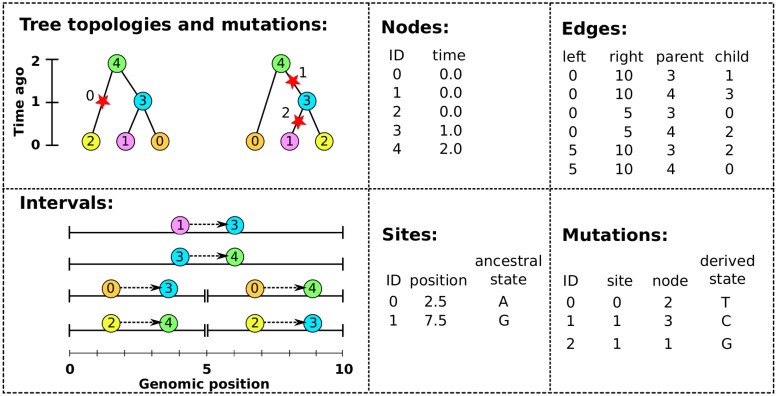
Fig 3. An example tree sequence with three samples over a chromosome of length 10.
The leftmost panels show the tree sequence pictorially in two different ways: (top) a sequence of tree topologies; the first tree extends from genomic position 0 to 5, and the second from 5 to 10; and (bottom) the edges that define these topologies, displayed over their corresponding genomic segment (for instance, the edge from node 2 to node 4 is present only on the interval from 0 to 5). The remaining panels show the specific encoding of this tree sequence in the four tables (nodes, edges, sites and mutations).

