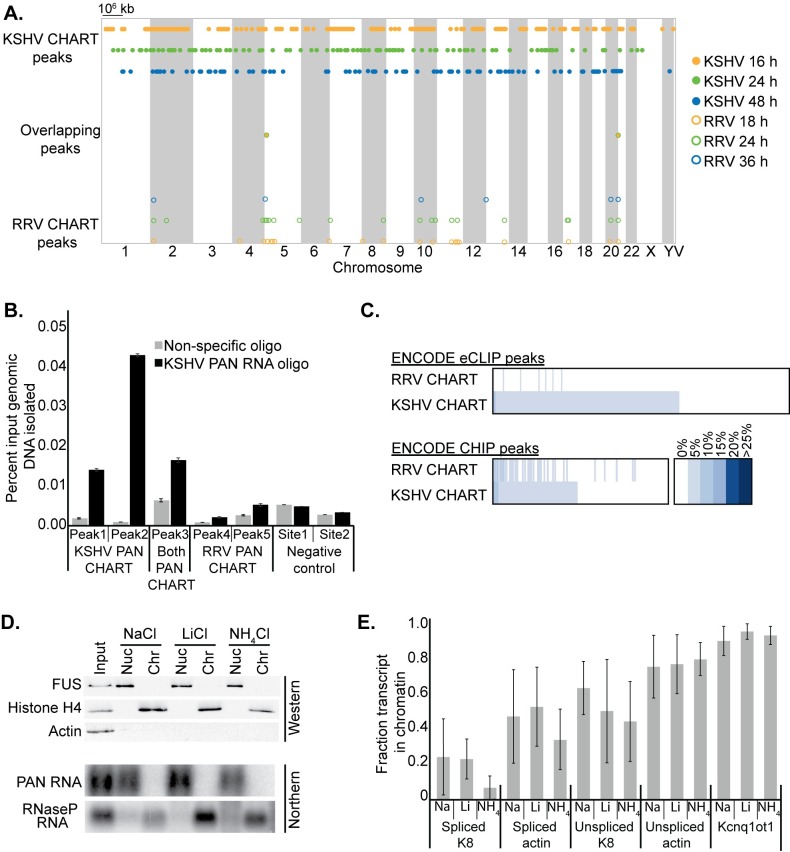
Fig 4. PAN RNA does not associate with chromatin as assessed by CHART or by cell fractionation.
(A) Distribution of PAN RNA CHART peak loci along all 23 human chromosomes and on the viral chromosome (V). KSHV CHART peaks are closed circles and RRV CHART peaks are open circles. CHART peaks are plotted for the time point at which the enrichment of that genomic locus was at its maximum. Only two overlapping peaks were called in KSHV and RRV CHART datasets and are plotted on a separate line. See S1 Appendix for detailed data. (B) qPCR validation of KSHV PAN RNA binding to genomic loci identified by CHART peak calling. DNA associated with KSHV PAN RNA was isolated from BCBL-1 cells 48 h after lytic induction using CHART oligonucleotide set 1. See S3 Appendix for qPCR primer and amplicon details. Peaks were identified in only the KSHV dataset (KSHV PAN CHART, Peaks 1 and 2), only the RRV dataset (RRV PAN CHART, Peaks 4 and 5) or both datasets (Both PAN CHART, Peak 4). The negative control sites are on the viral genome and lacked any CHART enrichment in either dataset. (C) Overlap of CHART peaks with ENCODE eCLIP (275 datasets; 104 proteins) and ENCODE CHIP (162 proteins) peaks. Percentages represent the fraction of PAN RNA CHART peaks that overlap each ENCODE dataset. None of the datasets overlap more than 15% of the PAN RNA CHART peaks. The intensity of blue shading represents the extent of overlap between the datasets. Detailed data are shown in S2 Appendix. (D) Subcellular fractionation of lytic BCBL-1 cells does not detect PAN RNA in the chromatin fraction by Northern blot. Western blot for FUS (nucleoplasmic), Histone H4 (chromatin) and GAPDH (cytoplasmic) proteins verifies the purity of the three resulting fractions. Three different salts were exchanged in all fractionation buffers: NaCl, LiCl and NH4Cl. (E) qPCR RNA analysis of the fractionated samples, plotted as the amount of each transcript in the chromatin relative to the nucleoplasm. Kcnq1ot1 is a control chromatin-associated ncRNA [28, 29]. Data are the average of three biological replicates.

