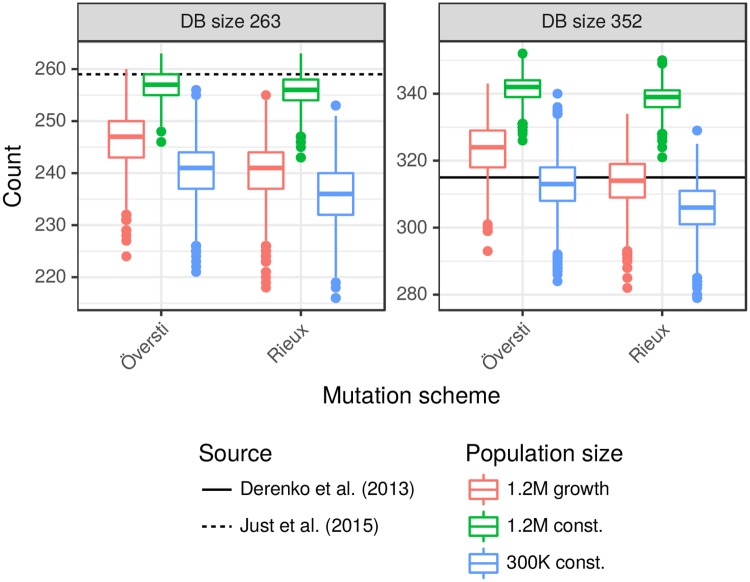
Fig 1. Comparison of simulated with US and Iranian databases.
Boxplots show the distribution of the number of distinct haplotypes arising from 2,500 random databases of sizes 263 and 351 obtained under our three demographic and two mutation models. The horizontal reference lines show the numbers of distinct haplotypes in US [15] and Iranian [16] databases of those sizes. See S1 Fig for distributions of the numbers of singletons and doubletons and details on how the boxplots were constructed.

