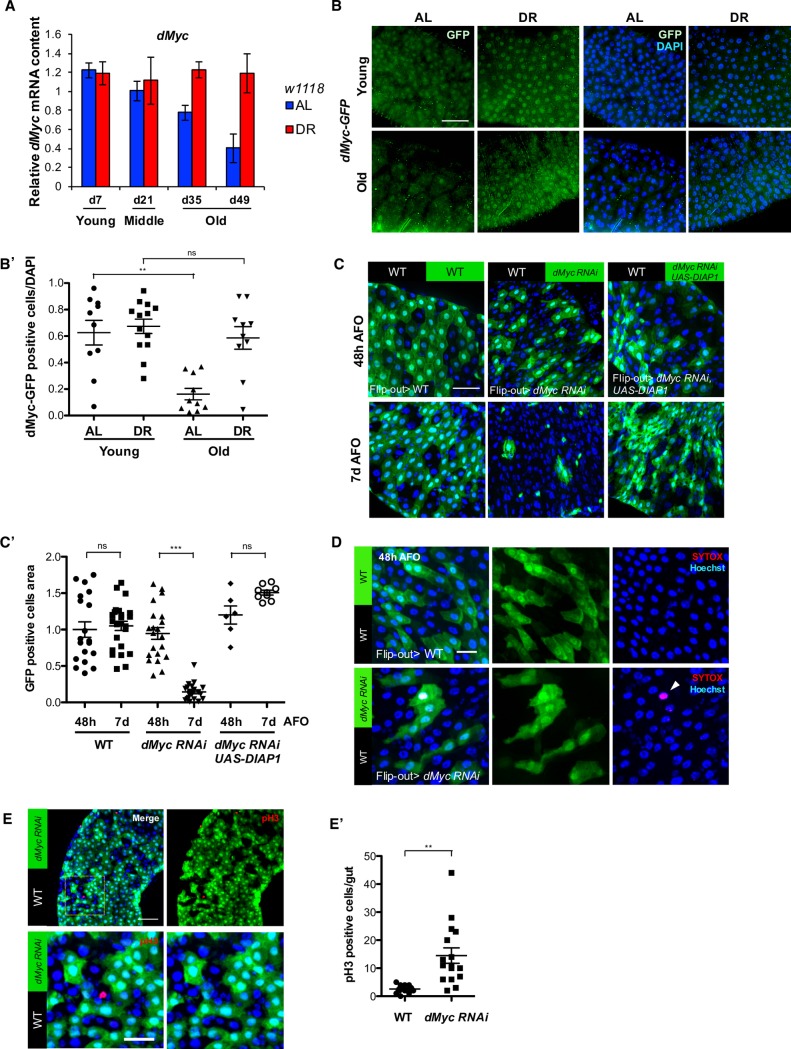
Fig 5. dMyc mediates improved intestinal cellular fitness upon dietary restriction.
(A) dMyc mRNA expression in dissected guts from w1118 upon AL and DR was measured with age. mRNA expression from flies at day 0 was set to 1. (B) Immunostaining of dMyc-GFP in dissected guts. dMyc:GFP flies were fed AL and DR diets for 7 days (Young) and 35 days (Old). Representative image (n = 10–13). Scale bar indicates 40 μm. (B’) Quantification of dMyc-GFP-positive cells from 10–13 images. (** p < 0.01 by t-test). (C) GFP-positive flip-out EBs/ECs were observed at 48 hours (Top panels) and 7 days after flip-out (AFO) (Bottom panels) in the posterior midgut upon DR. (Left) WT flip-out EBs/ECs. (Center) dMyc RNAi flip-out EBs/ECs. (Right) dMyc RNAi, UAS-DIAP1 flip-out EBs/ECs. Scale bar indicates 40 μm. (C’) Quantification of the size of GFP positive cells. (*** p < 0.001 by t-test). (D) SYTOX orange staining in the WT flip-out EBs/ECs (Top) and dMyc RNAi EBs/ECs (Bottom) in the posterior midgut upon DR at 48 hours AFO. (Left) merged image. (Middle) GFP-positive flip-out EBs/ECs. (Right) SYTOX staining. White arrow head indicates SYTOX positive cell. Nuclei were stained with Hoechst 33342. Scale bar indicates 20 μm. (E) Immunostaining of mitotic ISCs using dissected guts from dMyc RNAi flip-out flies upon DR at 48 hours AFO. (Top-left) merged image. (Top-right) GFP-positive dMyc RNAi EBs/ECs with pH3 staining. Bottom panels are magnified images of the yellow square in the top-left image. Scale bars of top and bottom panels indicate 40 and 20 μm, respectively. (E’) Mitotic ISCs quantification in the gut from WT flip-out and dMyc RNAi flip-out flies (n = 15). See also S5 Fig.

