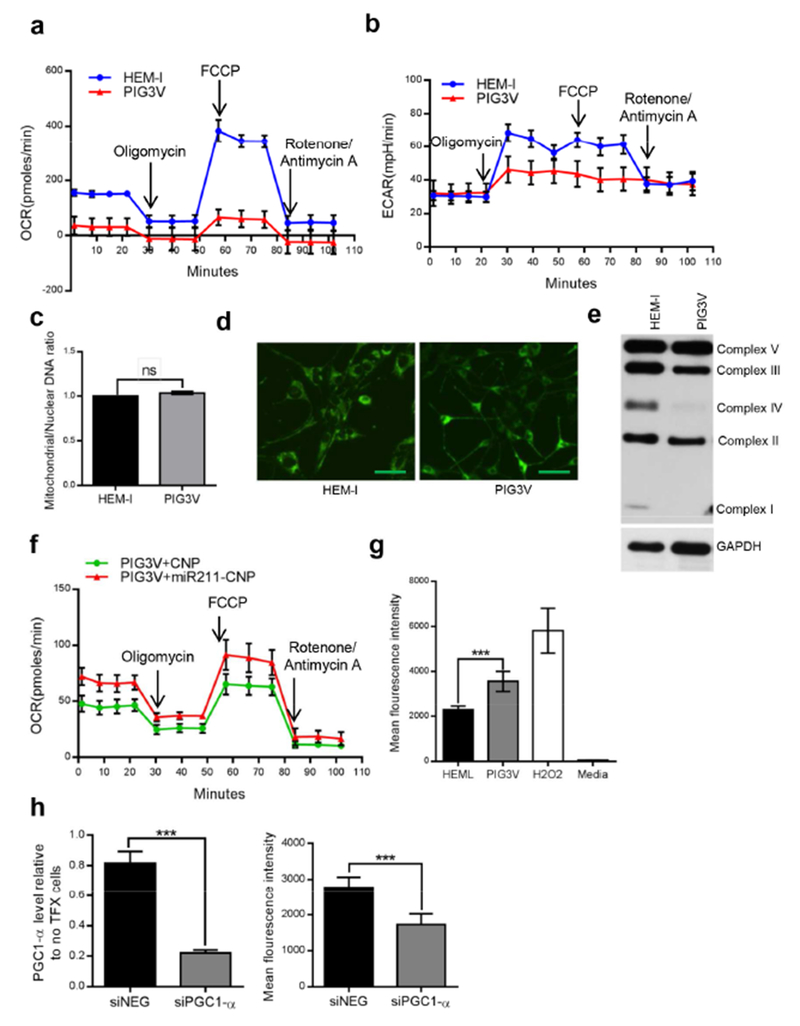
Figure 4. Reduced oxidative capacity in vitiligo melanocytes compared to normal melanocytes.
(a and b) Oxygen consumption rate (OCR) and extracellular acidification rate (ECAR) were analyzed using the Seahorse XF analyzer in HEM-l and PIG3V cells. (c) Ratio of mitochondrial to nuclear DNA content in HEM-l and PIG3V cells. (d) Mitochondrial content in HEM-l and PIG3V cells was analyzed by staining the cells with MitoTracker® Green. 20× magnification, scale bar represents 25uM (e) Mitochodrial complex expression in HEM-l and PIG3V cells by western blotting. (f) OCR in PIG3V cells treated either with miR211-CNP or control CNP at 2uM concentration. (g) Intracellular ROS levels were measured in 40,000 HEM-l or PIG3V cells using the OxiSelect™ Intracellular ROS Assay Kit with hydrogen peroxide as positive control. (h) PIG3V cells were transfected with either scrambled siRNA (siNEG) or siRNA against PGC1-α and analyzed for PGC1-α expression and intracellular ROS levels. Results shown are mean ± SDM and representative of at least three independent experiments. P values: **<0.01; ***<0.001

