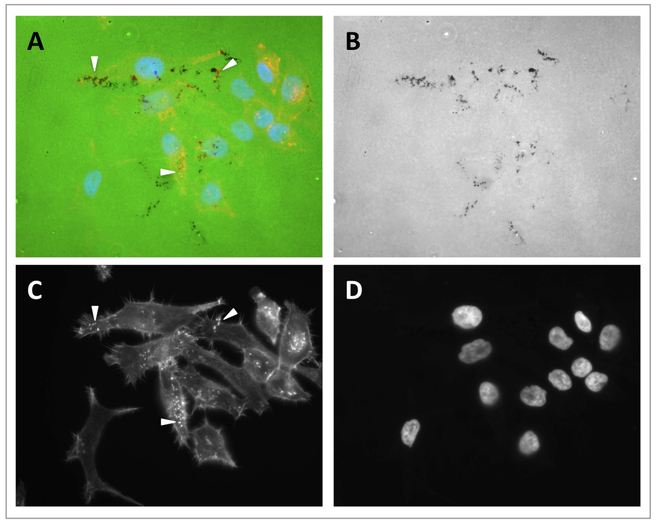
Figure 2. Representative images of invadopodia and gelatin degradation assay.
Digital images from a gelatin degradation assay performed on SCC61 cells. Images were obtained using a 40x objective in a fluorescence microscope. A. Merged channels showing fluorescent gelatin (green), F-actin staining (red) and nuclei (blue). B. Green channel (gelatin). C. Red channel (F-actin). D. Blue channel (nuclei). Arrowheads point to invadopodia in A and C.

