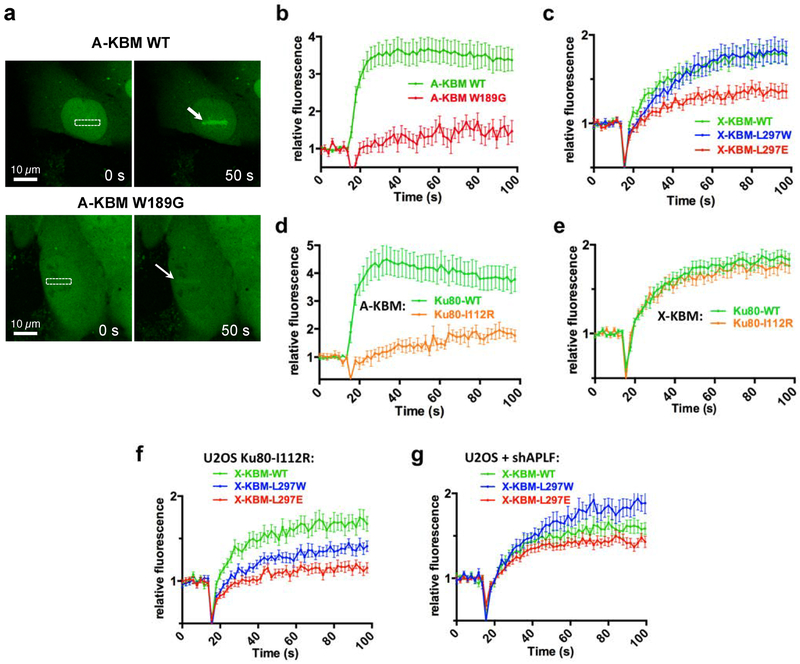
Figure 3. Life cell imaging of A-KBM and X-KBM recruitment after nuclear micro-irradiation.
(a) Wild-type (WT) and mutant CFP-(A-KBM) behaviour at 0 s and 50 s after laser nuclear micro-irradiation. The white rectangle and arrows mark irradiated areas. Magnification: X40. (b) Dynamics of wild-type and mutant CFP-(A-KBM) at laser-induced damage sites in U2OS cells. Mean values of relative fluorescence with s.e.m. were calculated from data obtained in several individual cells: n=23 and 19 cells for WT and mutant A-KBM, respectively). p values at last time point were calculated using unpaired two-tailed t-test: WT vs W189G p<0.0001. (c) Dynamics of wild-type and mutant CFP-(X-KBM) at laser-damaged sites as in b). n=27, 21, and 24 cells for WT, L297E and L297W X-KBM, respectively. p values at last time point : WT vs L297W p=0.8574; WT vs L297E p=0.0021. (d-e) Dynamics of CFP-(A KBM) (d) and (X-KBM) (e) at laser damaged sites in cells expressing wild-type or I122R mutant Ku80 as in b). n=20, 13 cells for A-KBM in WT or I122R Ku80, and n=48 and 39 cells for X-KBM in WT or I122R Ku80, respectively. p values at last time point : (d) WT vs I112R p=0.0002; (e) WT vs I112R p=0.5692 (f-g) Dynamics of wild-type and mutant CFP-(X-KBM) at laser-damaged sites in cells expressing I112R mutant Ku80 (f) or treated with a shAPLF (g) as in b). n=26, 28, and 21 cells for WT, L297E and L297W X-KBM in (f), and n=15 cells for each of WT, L297E and L297W X-KBM in (g). p values at last time point : (f) WT vs L297W p=0.023; WT vs L297E p=<0.0001; (g) WT vs L297W p=0.0144; WT vs L297E p=0.2654.

