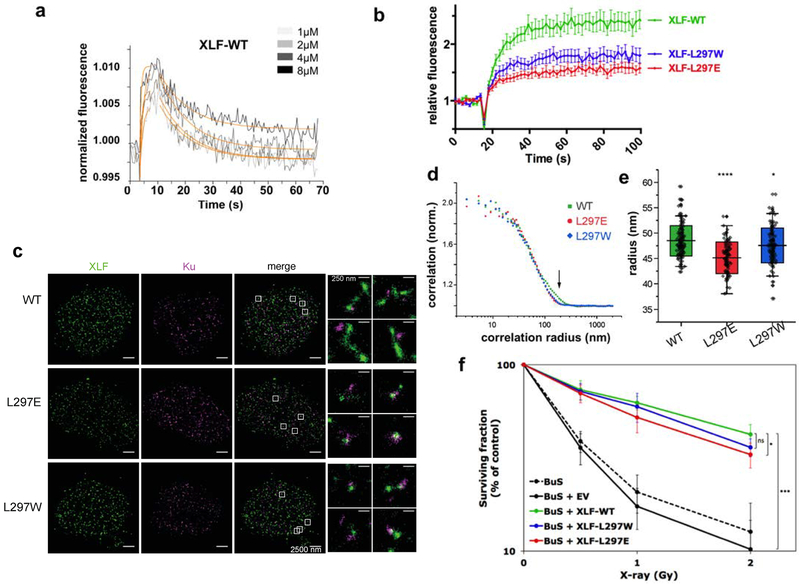
Figure 4. Biophysical and cellular analyses of XLF mutants in X-KBM.
(a) SwitchSENSE kinetic analysis of the WT XLF interaction with Ku-DNA complexes. Solid grey lines represent raw data (from 1 to 8 μM; light grey to dark grey; averages of triplicates). Global fitting was performed, following a single-exponential function (solid orange lines) yielding kinetic rate constants; kON=4.7 ± 1.7 105 M−1s−1 and kOFF = 9.1 ± 0.4 10−2s−1 for XLF(wt). (b) Dynamics of wild-type and mutant CFP-XLF at laser-damaged sites in BuS cells as in Figure 3b. n=20 cells for WT, L297E and L297W XLF. p values at last time point : WT vs L297W p=0.0093; WT vs L297E p<0.0001. (c) Representative super-resolution images of WT, L297E mutant, and L297W mutant BuS nucleus, with XLF and Ku displayed in green and magenta, respectively (scale = 2500 nm). Right: zoomed-in areas (scale = 250 nm). (d) Representative pair correlation function calculated from the 8×8 μm2 center square of one XLF nucleus image of WT (green), L297E (red), and L297W (blue) mutants. WT XLF shows bigger correlation radius (arrow). (e) Statistics of XLF foci size. Each plot represents the average XLF foci size (indicated as radius translated from the correlation radius) in one nucleus. Box’s height displays the s.d. with the mean value labelled in the middle. n=116, 95, 104 nuclei for WT, L297E, and L297W. The two-sample unpaired t-test between WT and L297E is p=10−13 while that between WT and L297W is p=0.03. (f) Cell survival of BuS cells complemented with vector (EV) or WT or mutated XLF. y axis is log scale. Error bars represent s.d., n=5 to 6 independent experiments. p values were calculated using unpaired two-tailed t-test: WT vs EV p=1.788e-06; WT vs LW p=0.068; WT vs LE p=0.021. (*p< 0.05, **p < 0.01, ***p < 0.001).

