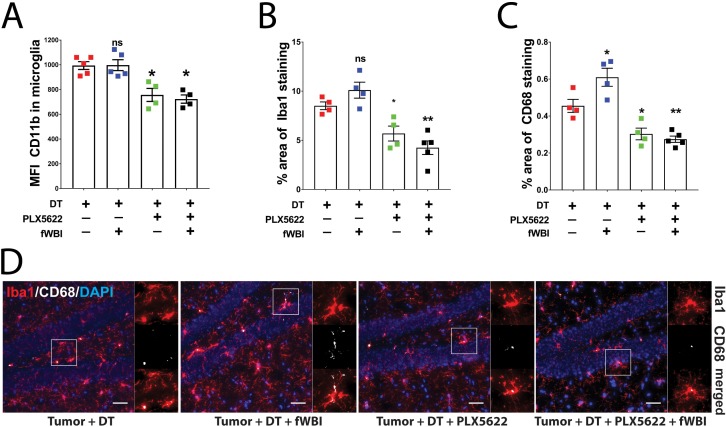
Figure 3. CSF-1R inhibitor treatment prevents fWBI-induced microglia activation in glioma bearing mice.
(A) Plots of the CD11b mean fluorescent intensity of microglia in the contralateral hemisphere of tumor bearing mice. There was significant decrease of microglial CD11b MFI in CSF-1R inhibitor treated mice. there was significant CSF-1R treatment effect F(1,14) = 38.77, p<0.0001 with no significant fWBI effect or interaction. (B) Quantifications of Iba1 +signal covered area. two-way ANOVA revealed significant PLX5622 treatment effect, F(1,13) = 39.14, p<0.0001, no significant radiation effect F(1,13) = 0.01122, p=0.9173 and significant interaction between PLX5622 treatment and fWBI, F(1,13) = 4.793, p=0.0474. There was a trend of increase in the tumor +DT + fWBI group (p=0.3044), and significant reduction in the tumor +DT + PLX group (*p=0.0381) and the tumor +DT + PLX+fWBI group (**p=0.0017), compared to the tumor +DT group. (C) Quantifications of CD68 +signal covered area. Two-way ANOVA revealed significant CSF-1R inhibitor treatment effect, F(1,13) = 53.07, p<0.0001, no significant radiation effect F(1,13) = 3.559, p=0.0817, and significant interaction F(1,13) = 7.529, p=0.0167. (D) Representative images of Iba1 and CD68 staining, showing Iba1 staining in red, CD68 staining in white and DAPI in blue. Scale bar = 50 um. (A-C, Two-way ANOVA with Dunnett’s multiple comparisons test vs the tumor +DT group, ns = not significant, *p<0.05, **p<0.01. each dot represents value from one mouse (A) or the mean values of Iba1 and CD68 (B and C) staining quantification of 3 snapshots in the hippocampus, N = 4–5. Error bars show mean ±SEM.


