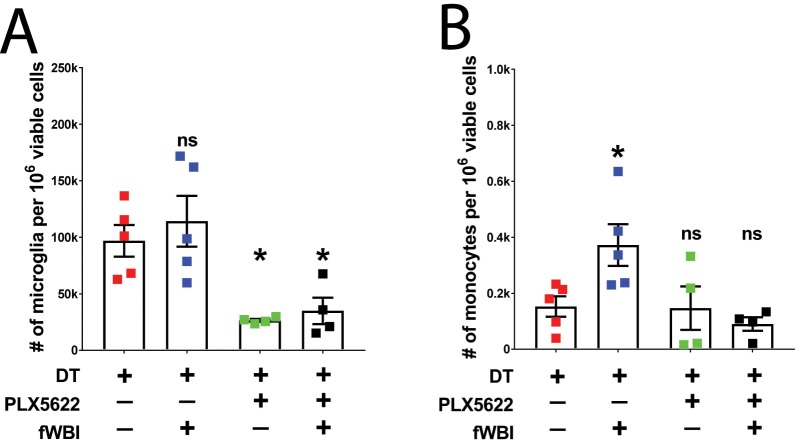
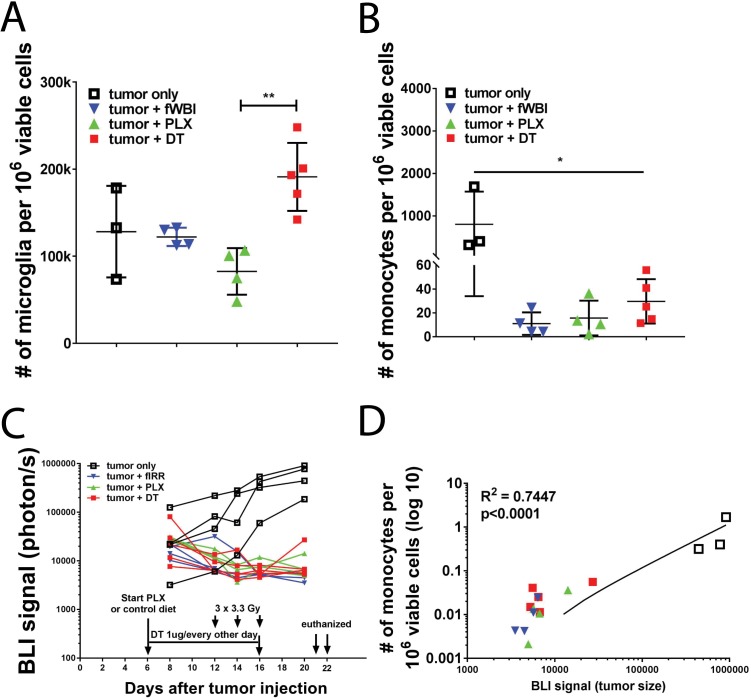
Figure 4. Treatment with a CSF-1R inhibitor alters myeloid cell composition in the contralateral hemisphere.
(A) Plot of microglia (CD11b + CD45 lo) numbers in treated tumor bearing mice. There was significant CSF-1R inhibitor treatment effect (F(1,8) = 31.45, p=0.0005), but no significant radiation effect or interaction between these two treatments. Two-way ANOVA with Dunnett post-hoc comparisons against the tumor +DT group, ns = not significant, *p<0.05. (B) Plot of inflammatory monocyte (CD11b + CD45hiLy6Chi) numbers in treated tumor bearing mice. There was significant radiation effect (F(1,8) = 10.68, p=0.0114) and CSF-1R inhibitor treatment effect (F(1,8) = 23.49, p=0.0013), as well as significant interaction (F(1,8) = 5.52, p=0.0467) between these two treatments, two-way ANOVA with Dunnett post hoc comparisons against the tumor +DT group, ns = not significant, *p<0.05. Error bars show mean ±SEM values. Each dot represents cell count from a mouse, N = 4–5.


