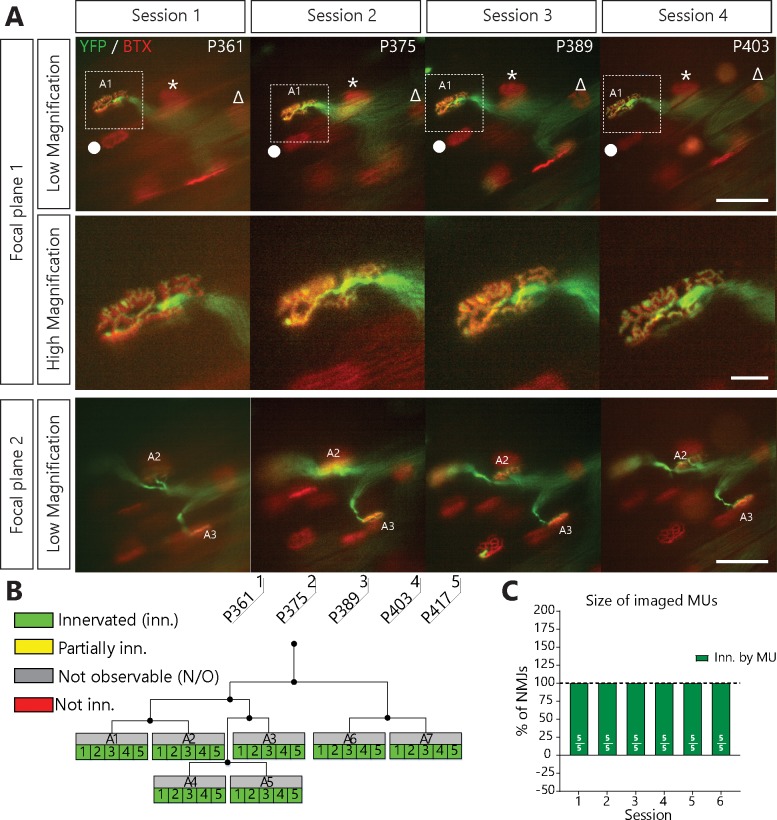
Figure 1. NMJs in a single motor-unit of WT/YFP mice are stable.
(A) Images at different focal planes of the same MU arbor from a WT/YFP mice during four sessions, with a higher magnification on-focus image of one NMJ (digital zoom, dashed box in low magnification). Green: YFP-labeled axon; Red: nAChR. Symbols (Δ, *, ●) identify landmarks used to confirm that the same region was imaged. (B) MU dynamic diagram of the MU shown in (A) showing that all NMJs within that motor arbor are stable in WT/YFP mice. Black lines and dots represent the axonal arborization and branching points respectively, while each box represents a single NMJ. (C) Histogram showing the average proportion of NMJs which are innervated (green) by the MU, showing that all MU preserved their NMJs in WT/YFP mice. Individual results for all MUs from WT mice (N = 5), including graphical representations, are included in Figure 1—source data 1. Details on how NMJs were classified, with representative examples, are presented in Figure 1—figure supplement 1. Scale bar, low magnification: 100 μm; high magnification: 25 μm.


