. 2018 Oct 22;7:e39196. doi: 10.7554/eLife.39196

Figure 3. CrebB is required in MB α/β and MB α’/β’ neurons for LTM formation.

(A, B) Brains were stained using anti-GFP (green), anti-Discs large (Dlg, blue) and anti-Eyeless (Ey, red) antibodies, which labels Kenyon cells. (A–A’’) CrebB::GFP is expressed in Kenyon cells of CrebBcKO; tubGal80ts male flies. (B–B’’) After induction of mushroom body-specific CrebB::GFP knockout, Ey-expressing Kenyon cells lost GFP expression. Scale bars: 25 μm. (C–F) Different MB-Gal4 driver lines were used to induce deletion of CrebB in Kenyon cells and to test for the requirement of CrebB for 24 h memory. (C) Induction of CrebB knockout in the entire MB using OK107-Gal4 severely impaired LTM. N ≥ 10. (D, E) The 24 h memory scores were significantly reduced by the knockout of CrebB in MB α/β neurons with c739-Gal4 (N ≥ 9) and in MB α’/β’ neurons with c305a-Gal4 (N ≥ 8). (F) CrebB knockout in MB γ neurons with 5-HTR1B-Gal4 did not impair LTM formation. No significant difference was observed between the tested groups. N ≥ 8. Bar graphs represent the mean and error bars represent the standard error of the mean (SEM). Asterisks denote significant differences between groups; *p<0.05, **p<0.01, ***p<0.001 (Welch two sample t-test).

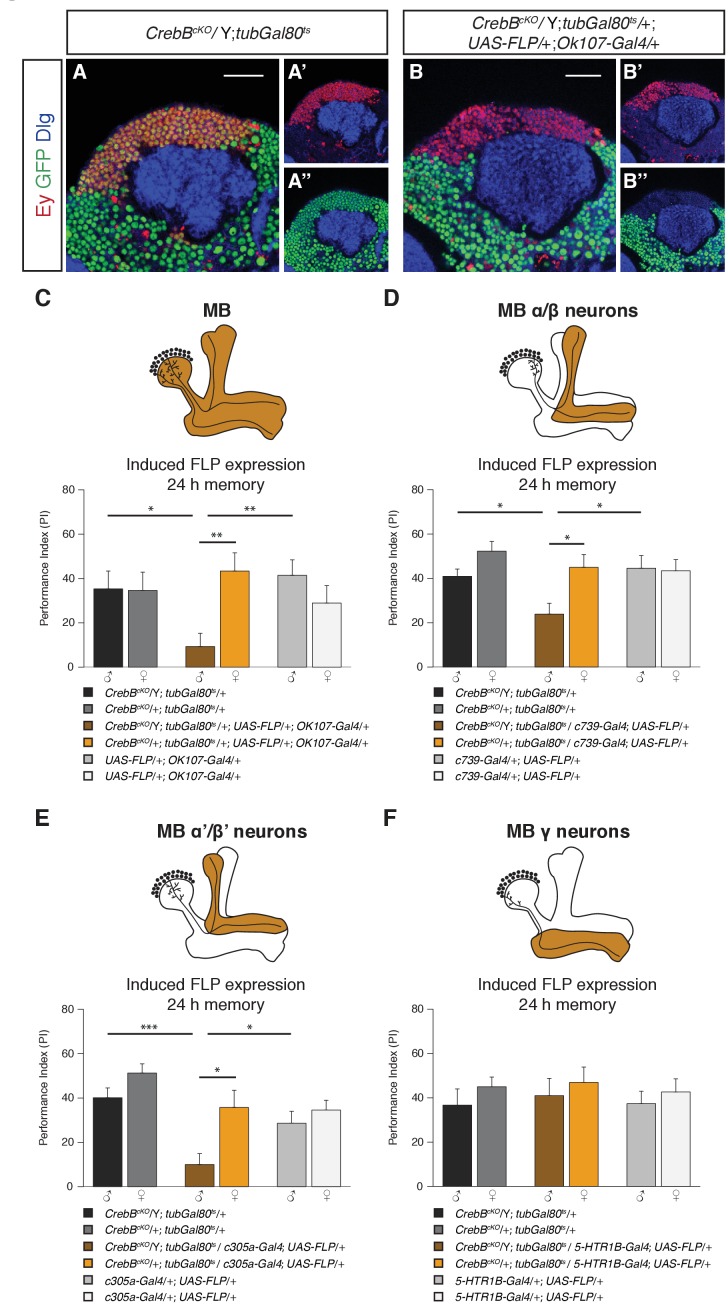
Figure 3.

Figure 3—figure supplement 1. STM is not affected by CrebB knockout in Kenyon cells.

Figure 3—figure supplement 1.

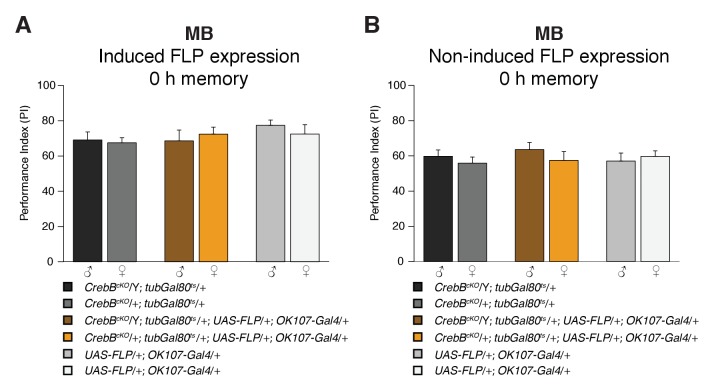
(A) Induced knockout of CrebB in MB neurons did not impair STM. Memory scores of the tested genotypes did not differ from each other (Welch two sample t-test). N = 8. (B) Non-induced CrebB knockout flies kept at low temperature showed no difference in STM performance compared to genetic control flies (Welch two sample t-test). N ≥ 8. Bar graphs represent the mean and error bars represent the standard error of the mean (SEM).
Figure 3—figure supplement 2. Non-induced controls display normal 24 h memory.

Figure 3—figure supplement 2.

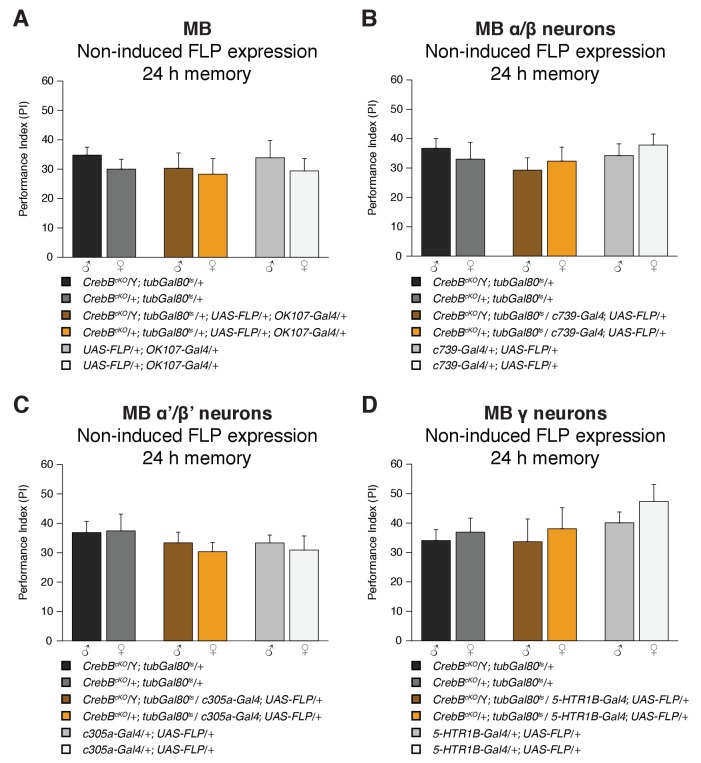
Flies that were used for CrebB knockout experiments in Kenyon cells were tested for LTM under non-induction conditions. 24 h memory performance of non-induced experimental flies was similar to the genetic control flies. Memory scores were not significantly different from each other for the MB knockout experiment (A; N = 8), the MB α/β neurons knockout experiment (B; N = 8), the MB α’/β’ neurons knockout experiment (C; N ≥ 8) and the MB γ neurons knockout experiment (D; N = 8; Welch two sample t-test). Bar graphs represent the mean and error bars represent the standard error of the mean (SEM).
Figure 3—figure supplement 3. Successful removal of CrebB::GFP from MB γ neurons.

Figure 3—figure supplement 3.

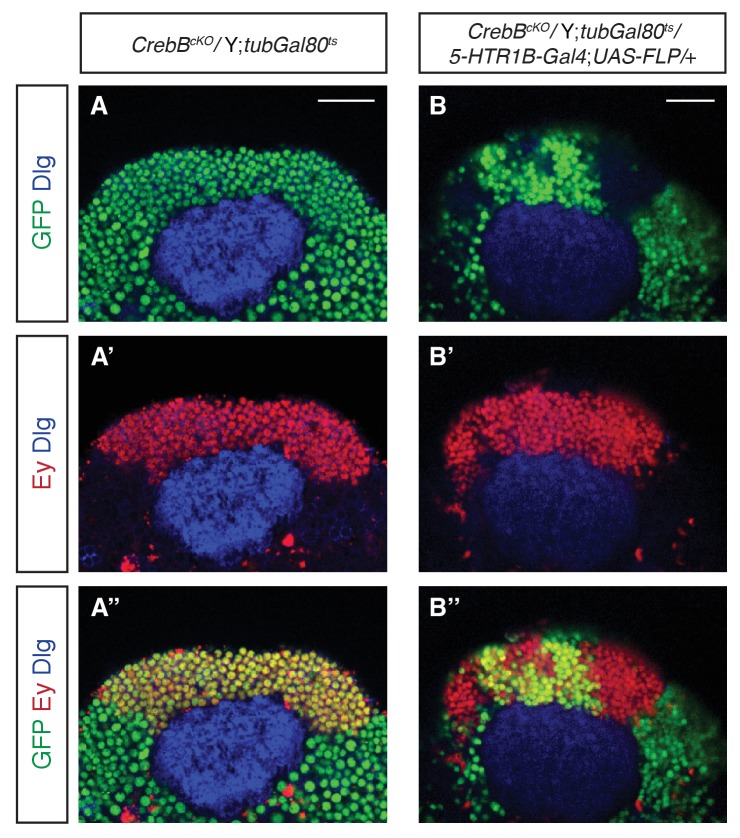
Confocal sections of adult brains showing the Kenyon cell (KC) region stained for GFP (green), the KC marker Eyeless (Ey, red) and Dlg to outline the neuropile (blue). (A, A’, A’’) In control flies, CrebB::GFP is expressed in all KCs. (B, B’, B’’) In flies with induced CrebB::GFP knockout in MB γ neurons, some KCs do not express CrebB::GFP anymore. Scale bars: 25 μm.