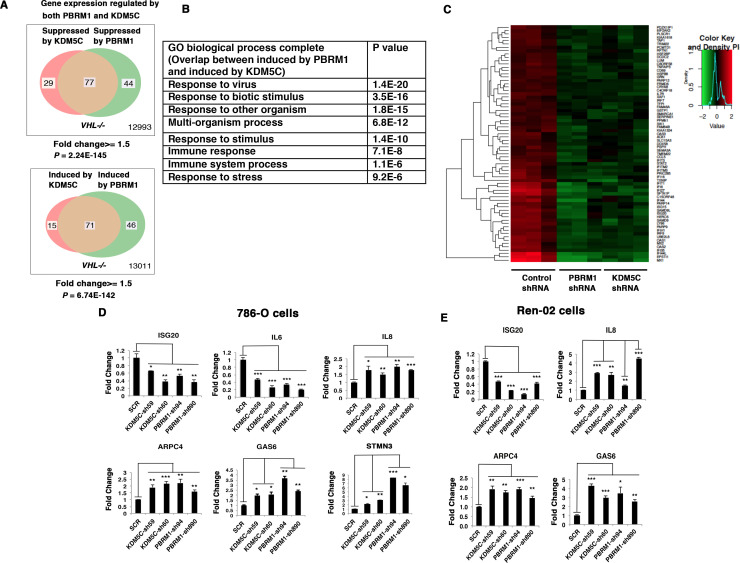
Figure 3. Suppression of KDM5C or PBRM1 had similar impact on gene expression in ccRCC cells.
(A) Venn diagrams showing the overlaps of genes whose expression are affected by PBRM1 or KDM5C losses in 786-O. The p-value significance of the overlap in a Venn diagram was calculated using hypergeometric test in R; (B) Enriched gene ontology (GO) analysis of genes regulated both by PBRM1 and KDM5C; (C) Heat map of shared gene targets by PBRM1 and KDM5C; (D-E) Examination of mRNA expression of individual genes by RT-qPCR in 786-O (D) and Ren-02 (E) after PBRM1 or KDM5C was suppressed by shRNA. The p-value significance in the bar graph was calculated with two-tailed student t test. *p<0.05; **p<0.01; ***p<0.001. analysis of the shared genes that are suppressed by PBRM1 or KDM5C did not reveal any significantly impacted pathway, but the shared induced genes showed that ‘response to virus’ was significantly enriched (Figure 3B). The heat map shows the commonly affected genes (Figure 3C). To confirm that the transcriptional response was not the result of the off-target effects of a single shRNA, we suppressed the expression of PBRM1 or KDM5C with two shRNA constructs each. Then, we measured the expression of selected IFN-responsive genes with RT-PCR, and found that the transcriptional changes in IL6, ISG20, IL8, ARPC4, GAS6, and STMN3 were consistent (Figure 3D). To ensure that our observation is not confined to just one cell line, we performed similar experiments in Ren-02 cells, another VHL-/- ccRCC cell line. Again, the suppression of PBRM1 or KDM5C with different shRNA constructs produced consistent transcriptional changes (Figure 3E), suggesting that PBRM1 loss or KDM5C loss elicits similar transcriptional responses.

