. 2018 Oct 25;7:e37925. doi: 10.7554/eLife.37925

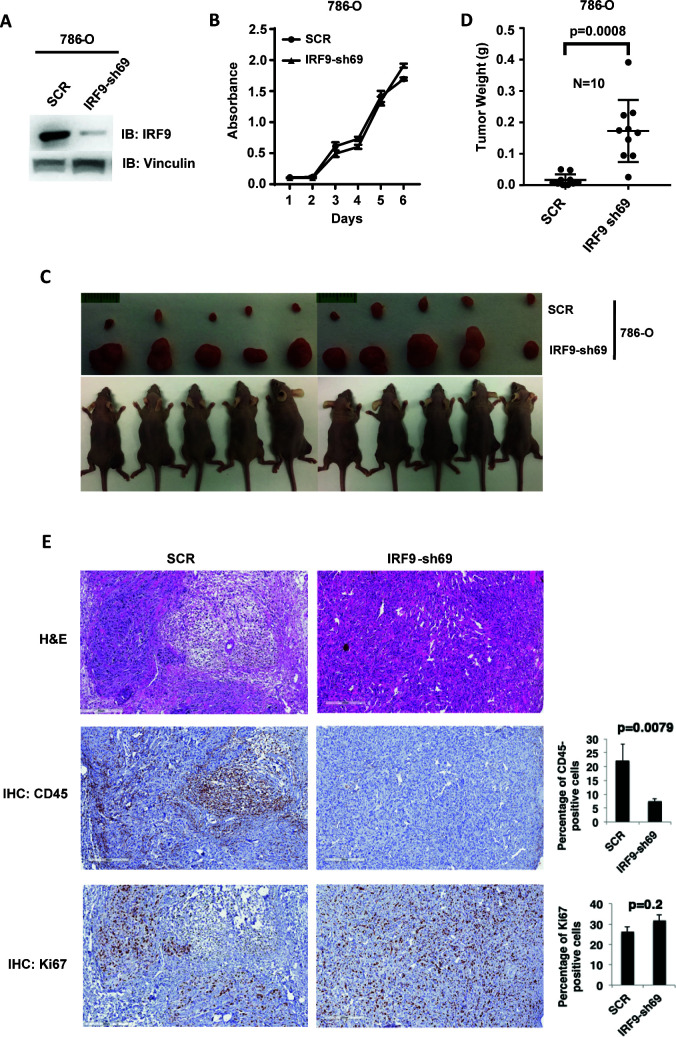
Figure 7. Suppression of IRF9, a key component of ISGF3, led to enhanced tumor growth and significantly less tumor-infiltrating immune cells.

(A) SDS-solubilized whole cell lysates of 786-O cells expressing control shRNA or shRNA against IRF9 were blotted with indicated antibodies; (B) The growth rate of the indicated cell lines measured by WST-1 assay; (C) Pictures of mice and xenografted tumors and (D) Quantification of tumor weights originating from same number of cancer cells described in (A) in athymic nude mice. The p-value was calculated with two-tailed student t test; (E) H&E or immunohistochemistry stains of slides from the representative pair five tumors. The percentages of CD45- or Ki67-positive cancer cells in the tumors were quantified with analytic programs in Aperio software. The p-values were calculated with Mann Whitney-Wilcoxon.

Figure 7.

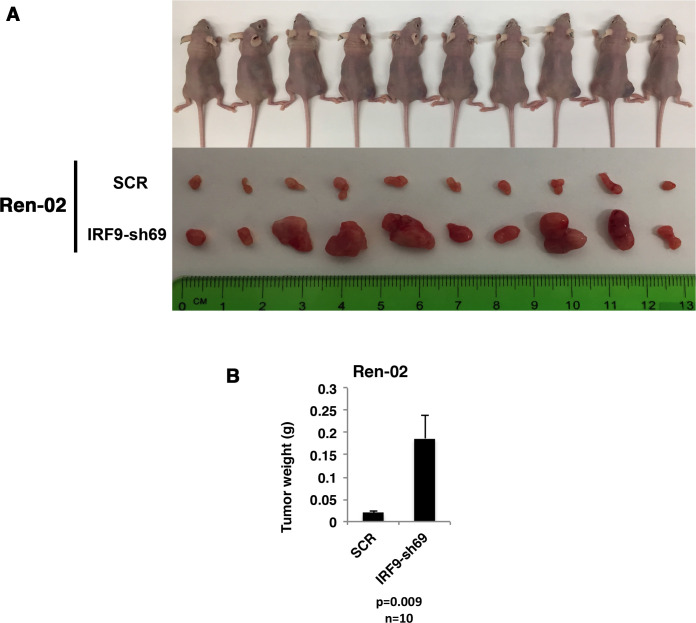
Figure 7—figure supplement 1. Suppression of IRF9 significantly enhanced tumor growth by Ren-02 cells.

Figure 7—figure supplement 1.

VHL-deficient ccRCC cells Ren-02 were stably infected with SCR or IRF9-sh69. (A) Pictures of mice and xenografted tumors and (B) Quantification of tumor weights originating from same number of cancer cells in athymic nude mice.
Figure 7—figure supplement 2. Stable suppression of IRF9 in ccRCC cells and xenograft tumors.
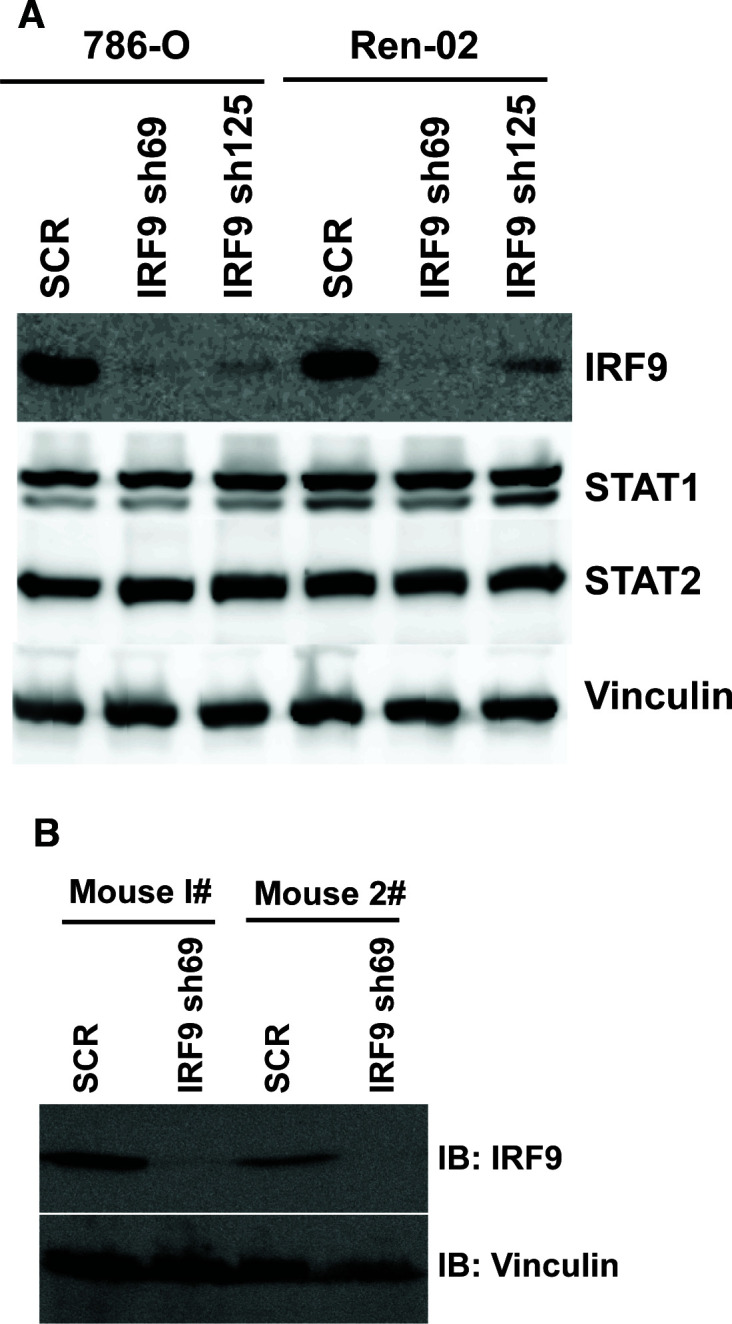
Figure 7—figure supplement 2.

(A) The IRF9 was suppressed by shRNA in 786-O or Ren-02 cells. The lysates were examined with indicated antibodies. (B) Lysates were made from two pairs of tumors described in Figure 7C (derived from 786-O cells) and immunoblotted with indicated antibodies.
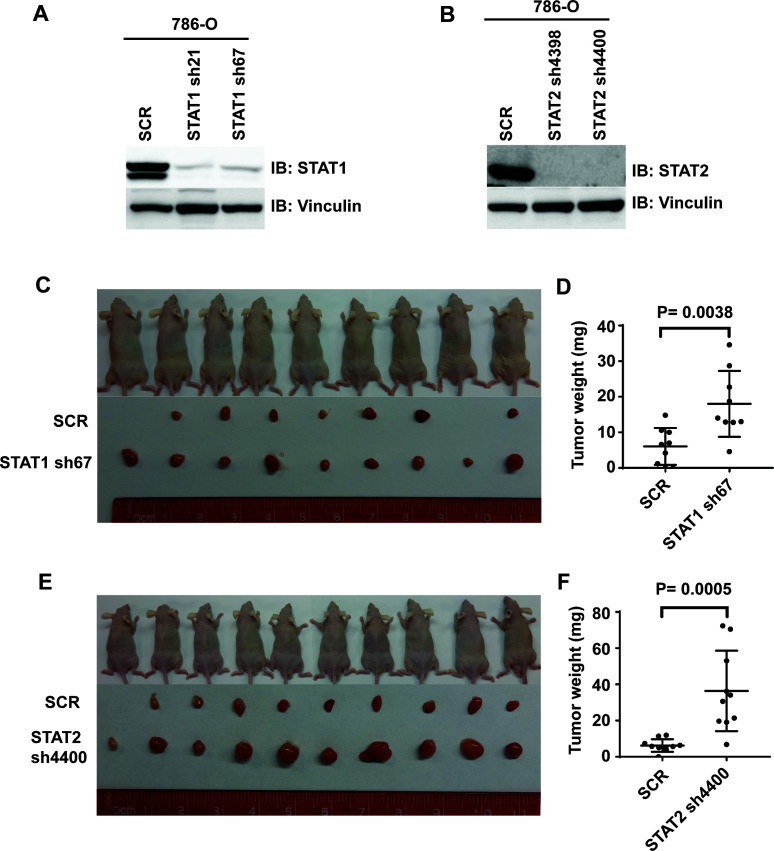
Figure 7—figure supplement 3. Suppression of STAT1 or STAT2 promotes tumor growth.

Figure 7—figure supplement 3.

STAT1 (A) and STA2 (B) were stably suppressed by shRNA in 786-O cells. Control cells and STAT1 or STAT2-suppressed cells were subjected to xenograft analysis. (C) and (E) Pictures of mice and xenografted tumors. (D) and (F) Quantification of tumor weights originating from the same number of cancer cells in nude mice.
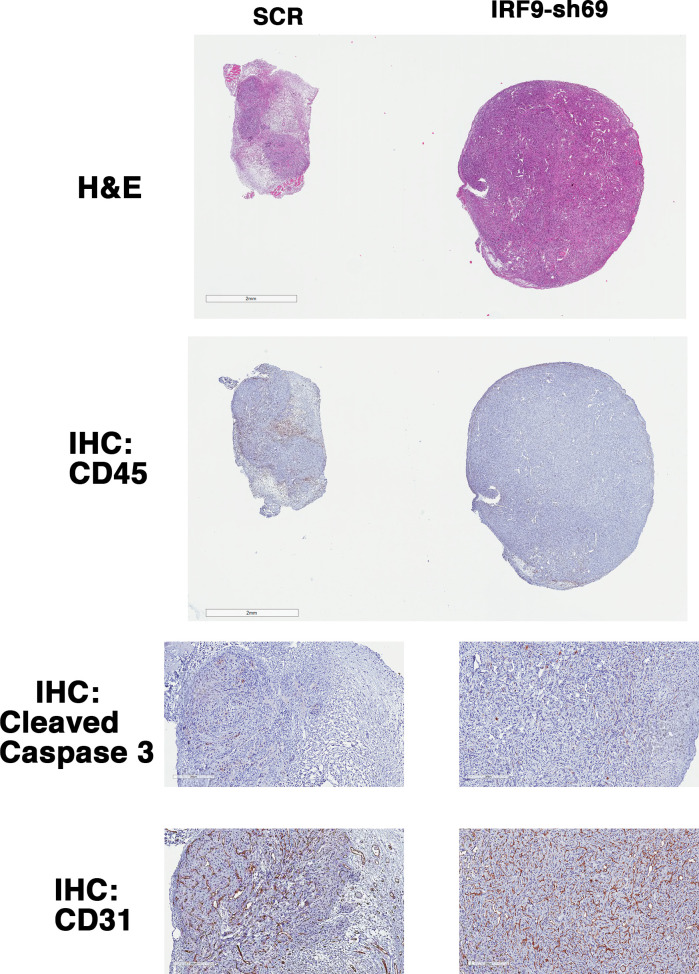
Figure 7—figure supplement 4. IRF9 loss does not lead to significant changes in apoptosis or blood vessel density.

Figure 7—figure supplement 4.

Representative 786-O xenograft tumors expressing SCR or IRF9-sh69 were subjected to H&E or immunohistochemistry analyses with indicated antibodies.