. 2018 Nov 1;7:e37550. doi: 10.7554/eLife.37550

Figure 2. Single grey-scale image of the densely reconstructed glomerulus VA1v with colour-coded profiles of different cells (key).

Figure 2.

Confirming the denseness of reconstruction, note that essentially all profiles are labelled, the few remaining dark grey belonging to orphan elements. Most profiles fall in the range of 0-5-1.5µm in diameter, with larger diameter axons giving rise to tiny dendritic neurites. Scale bar: 5 µm.

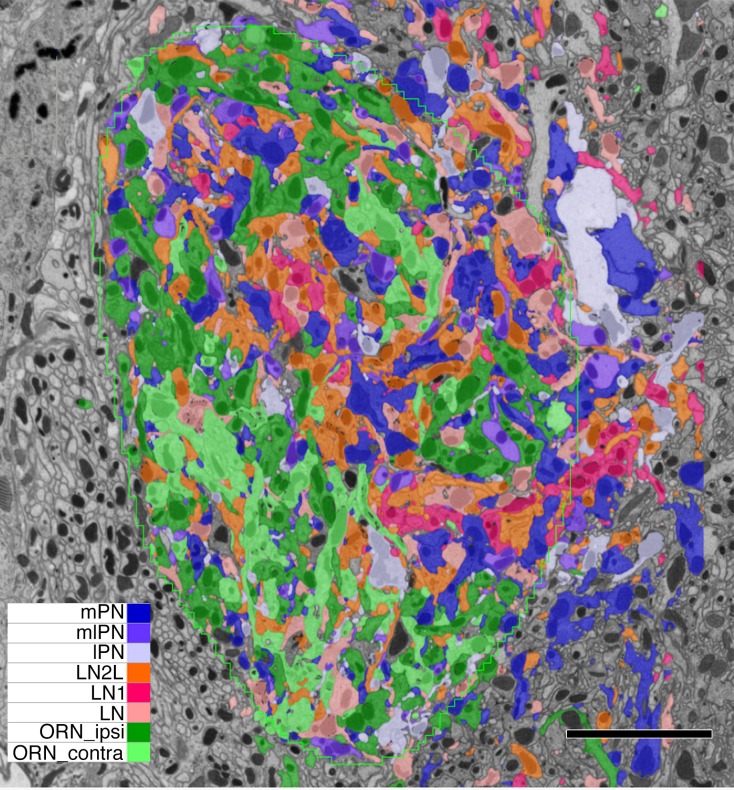
Figure 2—source data 1. List of quantitative features for all cells of the dataset.
Name - putative name based on Tanaka et al., 2012; Cell_ID - unique id given by NeuTu program; soma - location of soma, or soma tract (t); vol – volume of neurite in glomerulus; T-bars - number of presynaptic ribbons; Pre - targets of pre-synapse; Post – postsynaptic site; PSDs per T-bar – Average number of targets of pre-synapse; pre/post – ratio of targets of pre-synapses to postsynaptic site; T-bar/vol – number of T-bars per neurite vol (µm−3). Figure illustrates designation of pre- and postsynaptic sites.
elife-37550-fig2-data1.xlsx (109.2KB, xlsx)
DOI: 10.7554/eLife.37550.005