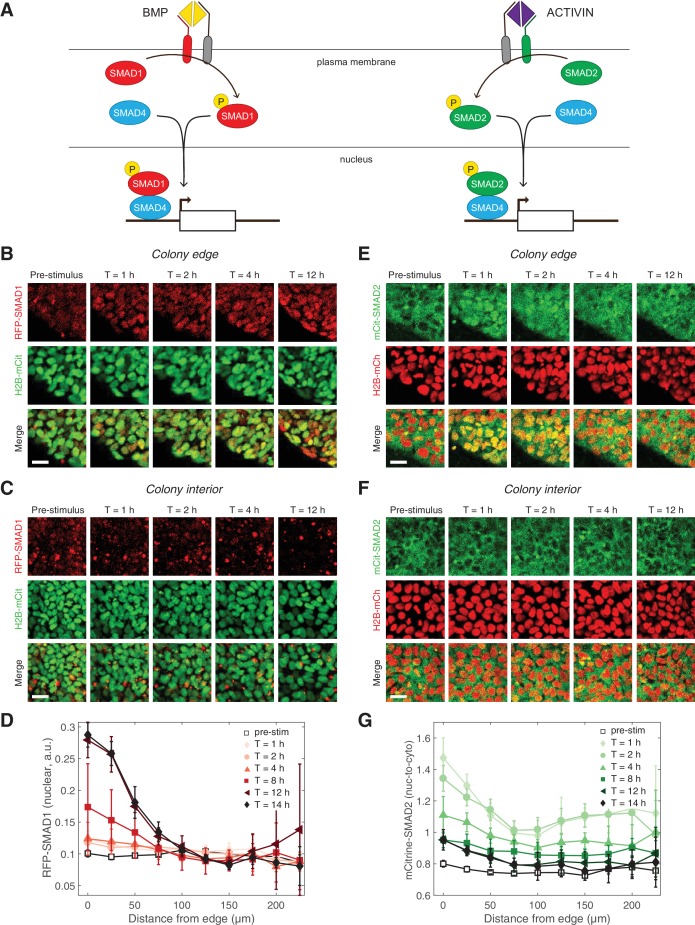
Figure 2. Two branches of the TGFβ pathway display different signaling dynamics.
(A) BMP and ACTIVIN signaling represent the two branches of the TGFβ pathway. BMP signals through R-SMAD1 and ACTIVIN signals through R-SMAD2. R-SMADs form a complex with co-SMAD4 and the complex regulates target gene expression. (B–C) RUES2-RFP-SMAD1 grown on micropatterned colonies in E7 and stimulated with BMP4 (50 ng/mL). The response of cells at the colony edge (B) and near the colony center (C) as a function of time following BMP4 presentation. The intensity range was adjusted to the same minimum and maximum values in all images in both (B) and (C). Scale bars, 25 µm. (D) Average RFP-SMAD1 nuclear signal as a function of radial position within the colony at different time points following BMP4 treatment. The single-cell nuclear RFP-SMAD1 intensity was quantified and normalized to the single-cell H2B-mCitrine signal. Error bars represent the standard deviation over n = 5 colonies from one experiment. (E–F) RUES2-mCit-SMAD2 grown on micropatterned colonies in E7 and stimulated with ACTIVIN (10 ng/mL). The response of cells at the colony edge (E) and near the colony center (F) as a function of time following ACTIVIN presentation. The intensity range was adjusted to the same minimum and maximum values in all images in both (E) and (F). Scale bars represent 25 µm. (G) Average mCitrine-SMAD2 nuclear-to-cytoplasmic signal as a function of radial position within the colony at different time points following ACTIVIN treatment. The single-cell nuclear mCitrine intensity was quantified and normalized to the single-cell cytoplasmic mCitrine signal. Error bars represent the standard deviation over n = 5 colonies from one experiment.


