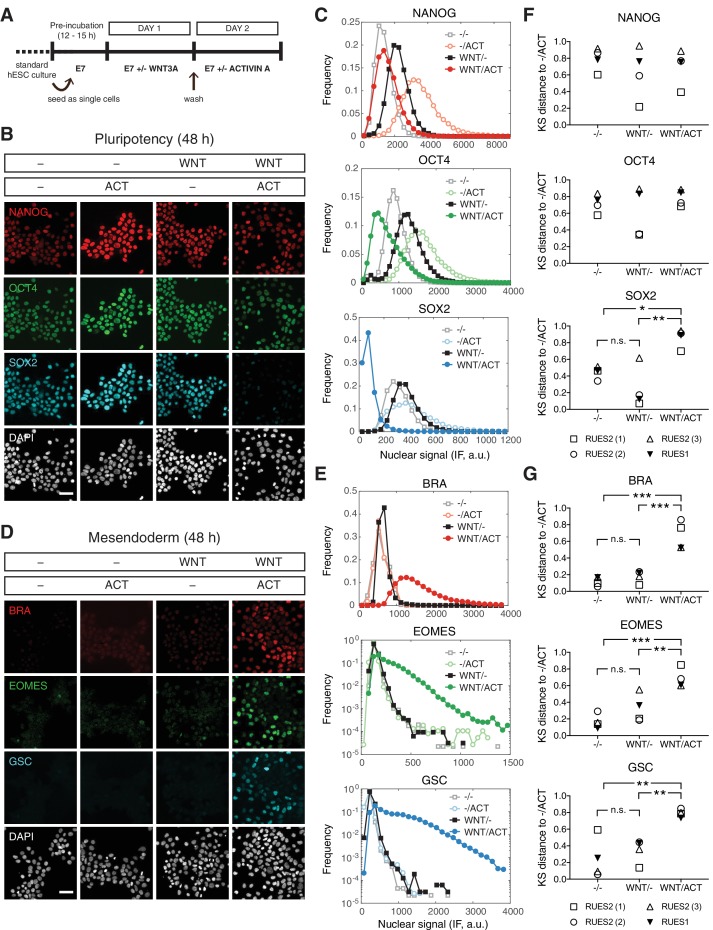
Figure 6. WNT priming unveils ACTIVIN-dependent mesendoderm differentiation.
(A) Schematic outlining the 2 day experimental protocol. (B–C) Cells were cultured for one day with or without WNT3A (100 ng/mL, top bar). On the second day they were washed to remove WNT and treated with or without ACTIVIN (10 ng/mL, bottom bar). After the second day cells were fixed and analyzed by immunofluorescence (IF). (B) Images: NANOG (red), OCT4 (green), SOX2 (cyan), DAPI (gray). Scale bar, 50 µM. (C) Histograms showing the nuclear IF signal quantified in single cells (n > 5,000 cells per condition). (D–E) Cells were cultured for one day with or without WNT3A (100 ng/mL, top bar). On the second day they were washed to remove WNT and treated with or without ACTIVIN (10 ng/mL, bottom bar). After the second day cells were fixed and analyzed by immunofluorescence (IF). (D) Images: BRA (red), EOMES (green), GSC (cyan), DAPI (gray). Scale bar, 50 µM. (E) Histograms showing the nuclear IF signal quantified in single cells (n > 5,000 cells per condition). (F–G) Kolmogorov-Smirnov (KS) distance of the cumulative probability distribution (CDF) of each marker to the reference CDF (-/ACT) for independent experiments in RUES2 and in RUES1 for the (F) pluripotency and (G) mesendoderm marker sets. n.s. (or comparison not shown), not significant, *p<0.05, **p<0.01, ***p<0.001, ANOVA.


