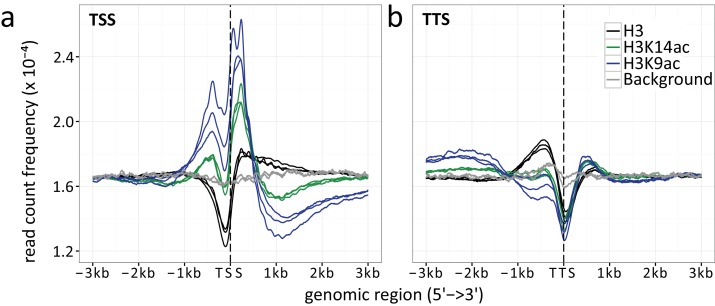
Appendix 1—figure 1. Read count frequencies for (a) TSSs and (b) TTSs.
Lines correspond to the relative enrichment of ChIP signal strength relative to the TSS/TTS averaged across all genes. ChIP-seq read count serves as a surrogate for signal strength (see methods for further details). Compared were the enrichment of histone H3 (black), H3K9ac (blue), H3K14ac (green) and the background control (gray) over an average of all TSSs and TTSs. The enrichment curves for all biological replicates are given, indicated by multiple lines per enrichment target.

