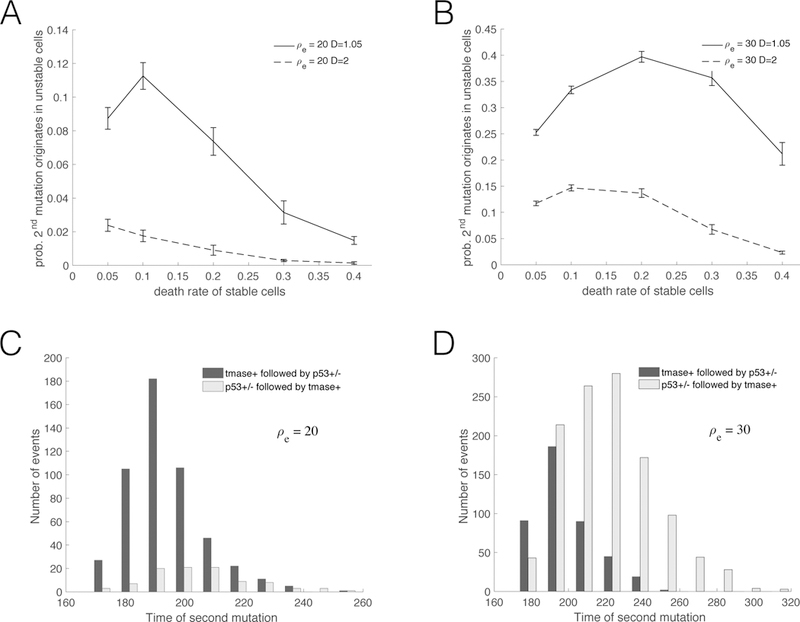
Figure 3.

(A) and (B): Probability that the first double mutant emerges from the population of unstable (W ) cells –conditioning over those instances where a double mutation occurred. Two different death rates of unstable cells are depicted, D = 1.05 (solid lines) and D = 2 (dashed lines). (C) and (D): Distribution of the arrival time of the first double mutant. The panels correspond to two different values of the replication capacity extension ρe, defined as the number of extra division that p53+/− cells can undergo before entering crisis. In (A) and (C) ρe = 20; in (B) and (D) ρe = 30. In all panels ρm = 50. In (C) and (D), d = 0.1 and D = 1.05.
