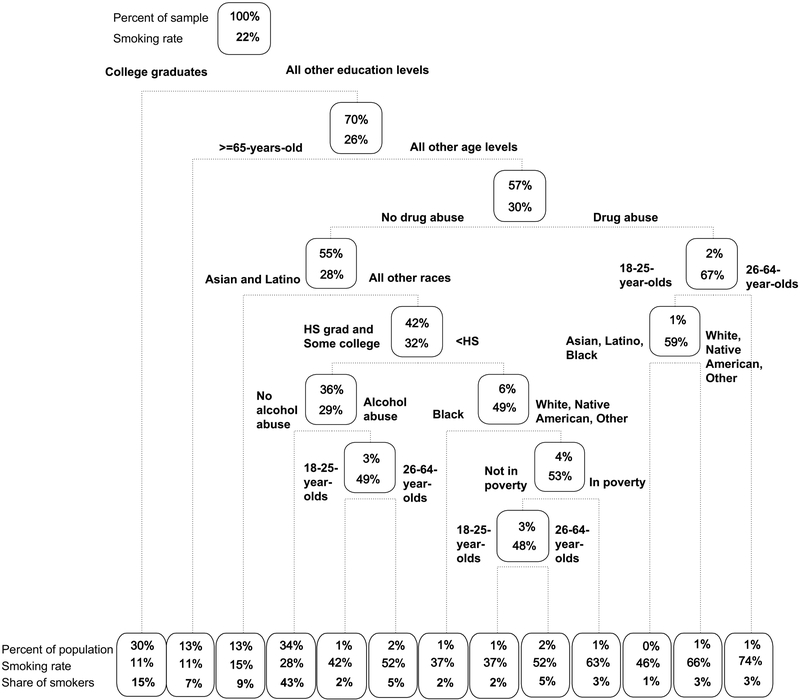
Figure 1:
A pruned, weighted classification and regression tree (CART) model of associations between current (past 30 days) smoking status and the following eight risk factors in the U.S. adult (≥18 years of age) population: educational attainment, age, race/ethnicity, past year drug abuse/dependence, past year alcohol abuse/dependence, annual income below federal poverty level, and past year mental illness in years 2011–2013 of the National Survey on Drug Use and Health (N = 114,246). Rectangles (nodes) represent the entire population (top-most node) or population subgroups (all other nodes). Within each node the top line lists the percent of the overall adult population represented within that node and the second line represents the smoking rate for that node. Using the root node as an example, this node represents 100% of the U.S. non-institutionalized adult population and 22% of them are smokers. Lines below nodes represent the binary branching around particular risk factors and risk-factor levels into subgroup nodes with further potential partitioning based on additional risk factors/levels. The bottom row comprises terminal nodes (i.e., final partitioning for a particular subgroup, minimal terminal node size set to ≥1000 individuals). Terminal nodes contain the same information as the other nodes plus an additional line showing percent of all adult current smokers represented by that node.

