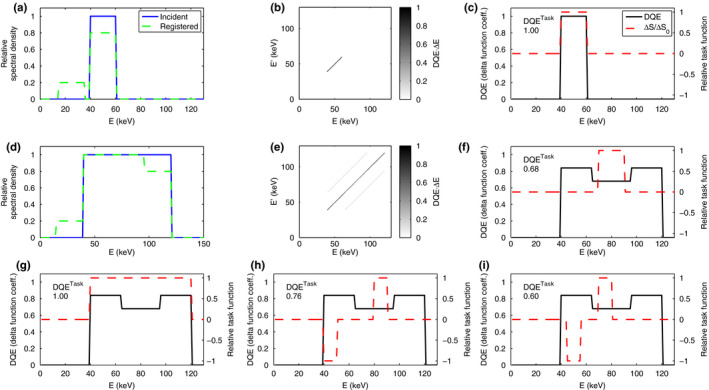
Figure 1.

Results for the fluorescence model. (a) Incident and deposited spectra in the nonoverlapping spectrum case, discretized with ΔE = 1 keV. (b) DQE matrix in the nonoverlapping spectrum case. (c) diagonal of the DQE matrix together with the task function and for a density imaging task in the nonoverlapping spectrum case. (d) Incident and deposited spectra in the overlapping spectrum case. (e) DQE matrix in the overlapping spectrum case. (f–i) Diagonal of the DQE matrix in the overlapping spectrum case, together with task function and for four different tasks: (f) nonoverlapping density imaging task; (g) overlapping density imaging task; (h) nonoverlapping spectral imaging task; and (i) overlapping spectral imaging task. Since DQE is singular, the plotted DQE curves in (c,f‐i) show the coefficient in front of . [Color figure can be viewed at wileyonlinelibrary.com]
