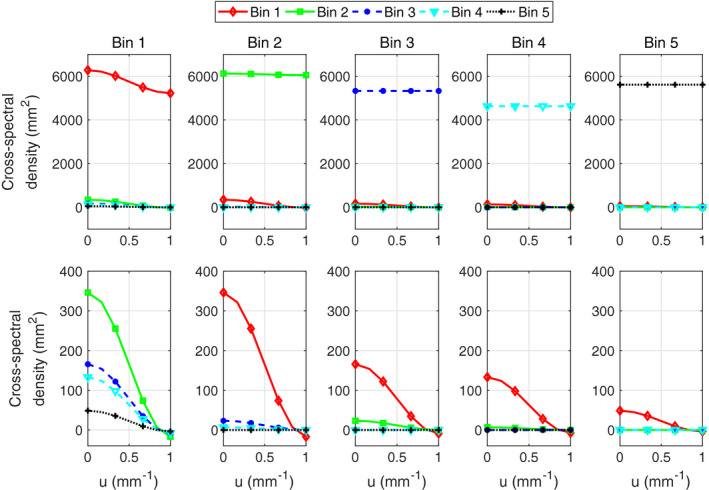
Figure 5.

Cross‐spectral density in the CdTe model for broad‐spectrum illumination, along the positive u axis up to the Nyquist frequency (). Each column of plots represents one k and each curve one . The lower row contains close‐up views of the upper plots. Note that each cross‐term is plotted twice since is symmetric in k and . [Color figure can be viewed at wileyonlinelibrary.com]
