Figure 3.
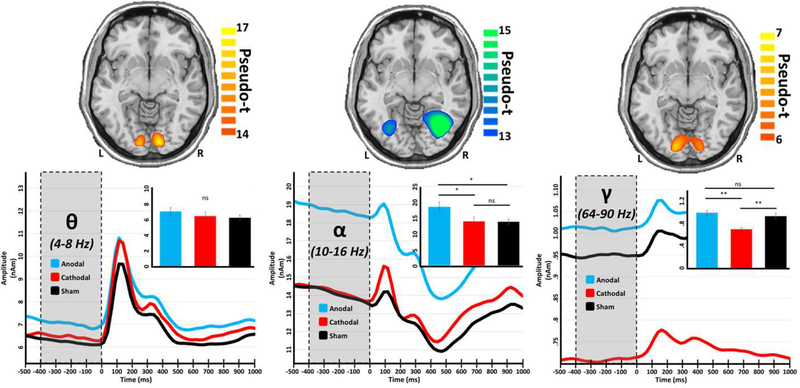
The polarity of tDCS differentially affects baseline amplitude in a frequency-specific manner. Axial slices (top) show group mean beamformer images of the bilateral visual responses at each frequency. The respective color legend for each image is displayed to the right. Peak voxel time series for each set of visual responses were extracted, averaged across hemisphere, and are displayed below their respective spatial map, with time (in milliseconds) denoted on the x-axes, and absolute amplitude (in nAm) denoted on the y-axes. Shaded regions (from −400 to 0 ms) represent the baseline period, over which average values were obtained for each participant. Inlaid bar graphs represent these baseline values averaged across participants per stimulation group, with significance levels of post-hoc analyses indicated by asterisks above the bars. *p < .05, **p < .01

