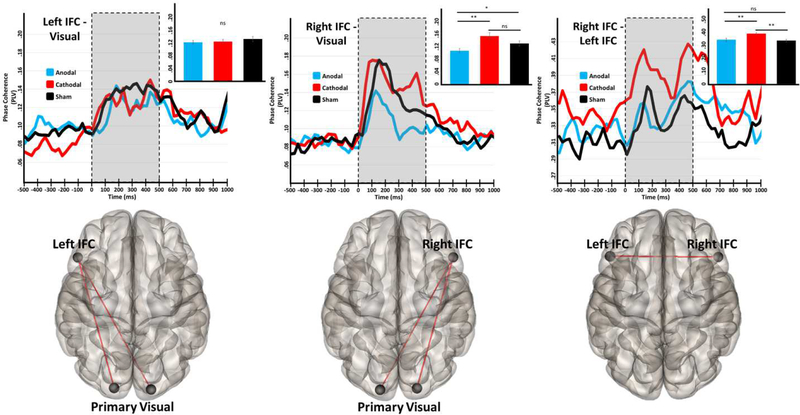
Figure 5.
tDCS selectively modulates the strength of functional connectivity among prefrontal and visual regions in the theta band. The glass brains under each plot represent the functional connections interrogated. Time series represent dynamic functional connectivity for each stimulation group, with time (in milliseconds) denoted on the x-axes and phase locking value (PLV) represented on the y-axes. In the fronto-occipital plots (left and middle panels) the time series has been averaged over the two pathways shown in the glass brain below. Shaded regions represent the “task-active” period over which PLV was averaged for each participant prior to statistical analyses, and inlaid bar graphs represent the average PLV for each stimulation condition. Significance levels of post-hoc statistical tests are indicated by asterisks above. *p < .05, **p < .01

