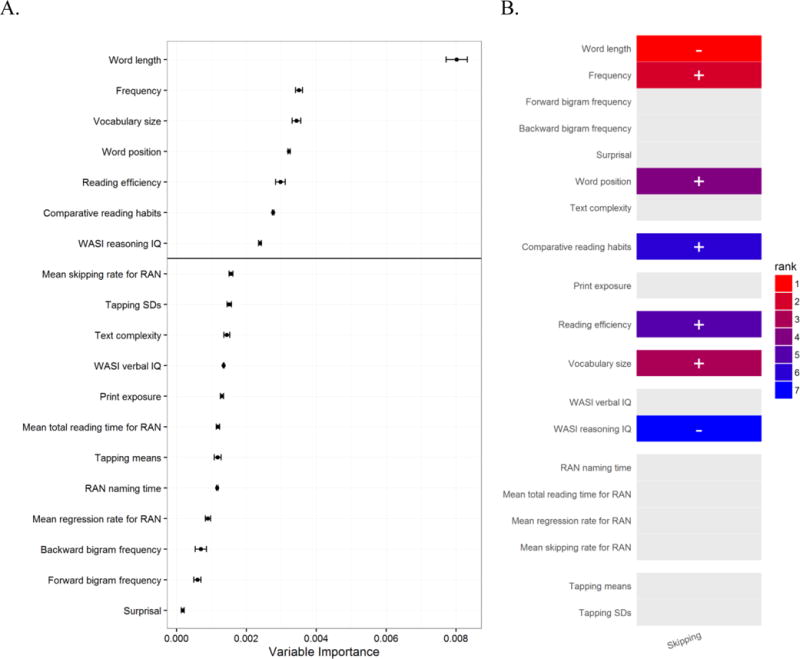
Figure 1.

Relative variable importance obtained from Random Forests models for skipping rate at the word level (Analysis 1). A. The variable importance scores are plotted in ascending order to show the rotated ‘Scree plot’, with the solid black horizontal line indicating the threshold chosen through visual inspection. Error bars represent the standard error of variable importance scores obtained from multiple runs of forests with different mtry parameters. B. A heat map representation of the variable importance where only variables above the threshold are colored according to their rank.
