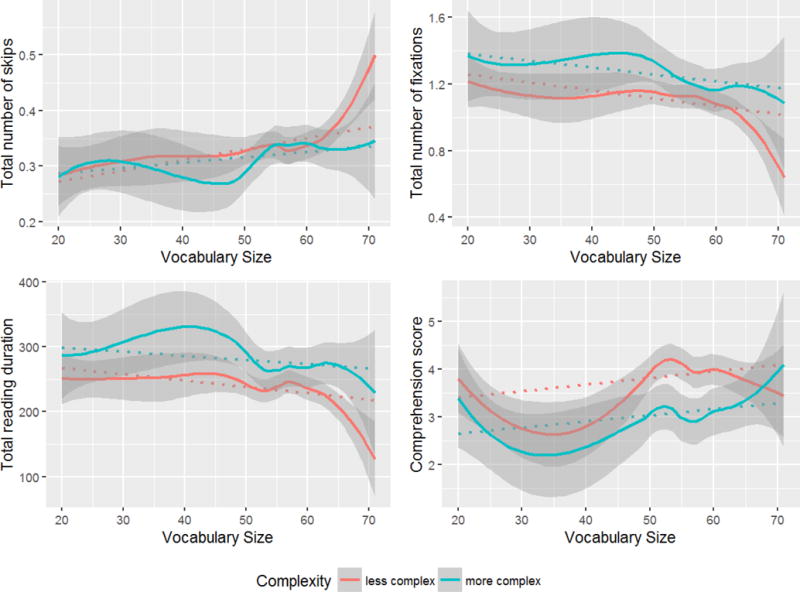
Figure 10.

Total number of skips, total number of fixations, total reading duration, and comprehension score as a function of vocabulary size for less (7, 8, and 9) and more (10 and 11) complex GORT passages. Dotted lines represent linear regression lines from the models fitted to an entire dataset, whereas solid lines represent the fits of local regression (loess) models.
