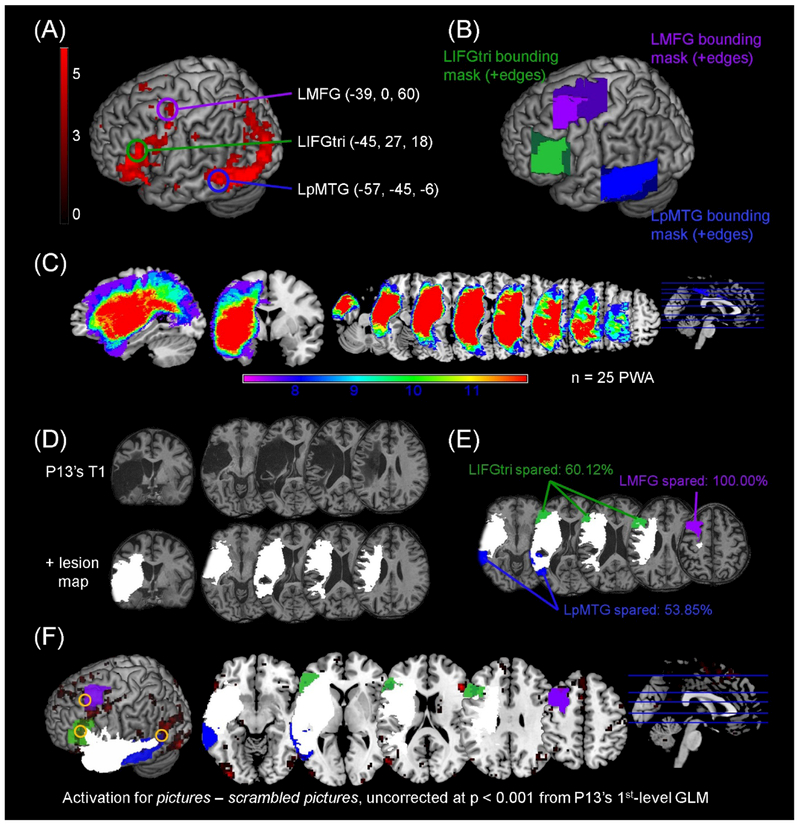
Figure 2.
Definition of anatomically-constrained bounding masks. (A) Rendered results of the control group 2nd-level analysis for pictures – scrambled pictures, uncorrected p < 0.001 are shown and activation peaks within each ROI that were used as the center input in the anatomically-constrained bounding masks are circled. (B) Rectangular bounding boxes at a search depth of 12mm are shown as dark edges. The edges were trimmed to constrain the masks to the anatomical boundaries of the ROIs, resulting in the three lightly-shaded masks used in other analyses. (C) Overlay of lesion maps from the patient group included in the DCM analysis are shown in sagittal, coronal and axial slices. (D) Lesion masks (in which lesioned voxels were deleted) were manually drawn slice-by-slice on each patient’s T1 structural image in native space to create lesion maps (in which lesioned voxels were preserved). The normalized lesion map overlaid on the normalized T1 structural image for one participant (i.e., P13) is shown to illustrate this process. (E) Each patient’s lesion map was overlaid onto the anatomical bounding masks shown in (B) in order to create individually-tailored bounding masks reflecting the spared tissue within each mask. The percentage of residual tissue within each mask was determined by subtracting the patient’s lesion volume from the volume of the anatomically-constrained bounding mask, divided by the volume of the mask. The lesion map (in white) and individually-tailored bounding masks are shown for P13. (F) Visual inspection of overlaid t maps for pictures – scrambled pictures, lesion maps, and individually-constrained bounding masks for each patient ensured that the extracted VOIs fell outside the lesion and within (or approximate to) the bounding mask borders. The location of P13’s VOIs extracted for the connectivity analysis are denoted by the yellow circles.

