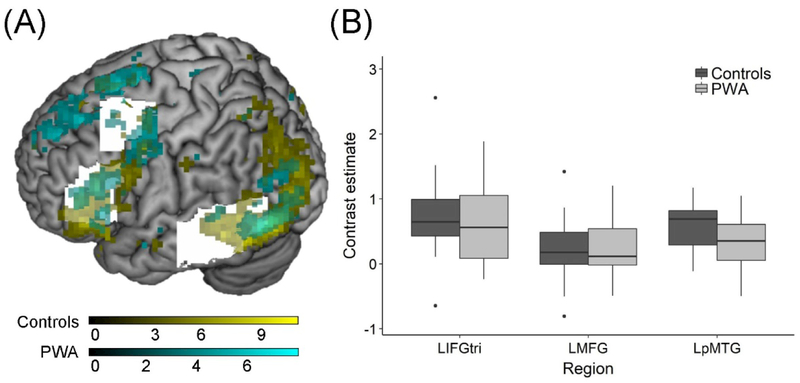
Figure 3.
Activity within bounding masks. (A) Rendered t-maps from the one-sample t-tests (at p < 0.001, uncorrected) in each group show activated clusters within the anatomical bounding masks (in white). (B) The comparison of contrast estimates extracted from the anatomical bounding masks for each participant revealed no significant differences.

