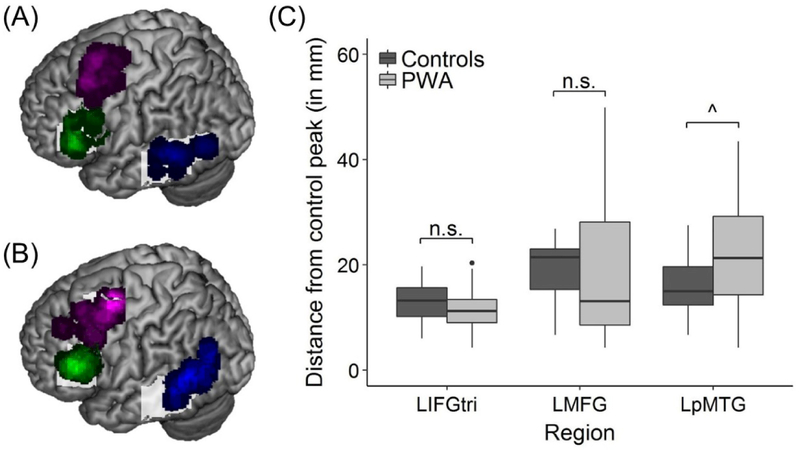
Figure 4.
VOI location. Overlays shown of all regional peaks for all (A) controls and (B) patients. (C) The results of the MANOVA revealed the distance between each subject’s regional peak and the corresponding bounding mask peak did not differ between groups for LIFGtri and LMFG but approached significance for LpMTG. Note: for overlay of patients’ VOIs, only functional spheres are shown (i.e., n = 21 LIFGtri VOIs, 24 LMFG VOIs, and 20 LpMTG VOIs)

