
Figure 3. SNR comparisons of two navigator methods at various TR.
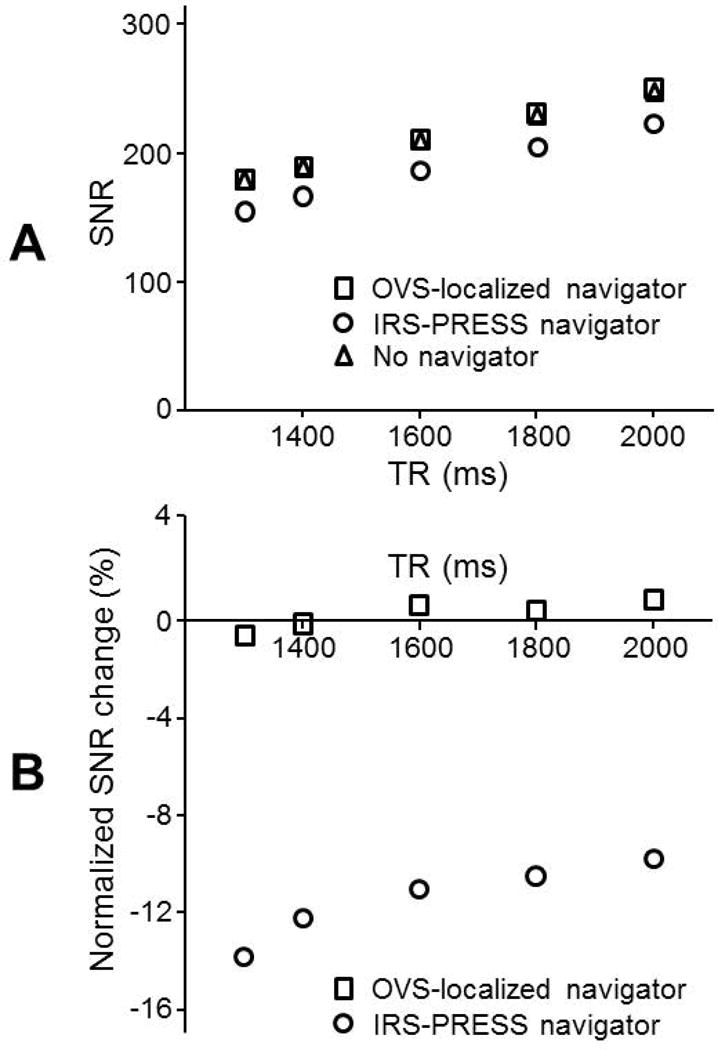
(A) SNR of MR spectra with the OVS-localized navigator was compared to that with the PRESS-IRS navigator using SVS measurements on a solution phantom containing acetate and lactate. SNR was computed as a ratio of area under the acetate peak to the root mean square noise from a solution phantom containing of acetate and lactate. SVS parameters were: number of data points=512, BW=2000 Hz, number of averages=42, voxel size=3×3×3 cm3, and TE=35 ms. (B) Normalized SNR changes, (SNR–SNRno-nav)/SNRno-nav, were calculated in reference to SNR without any navigator to compare the impact of a navigator addition in the two methods.