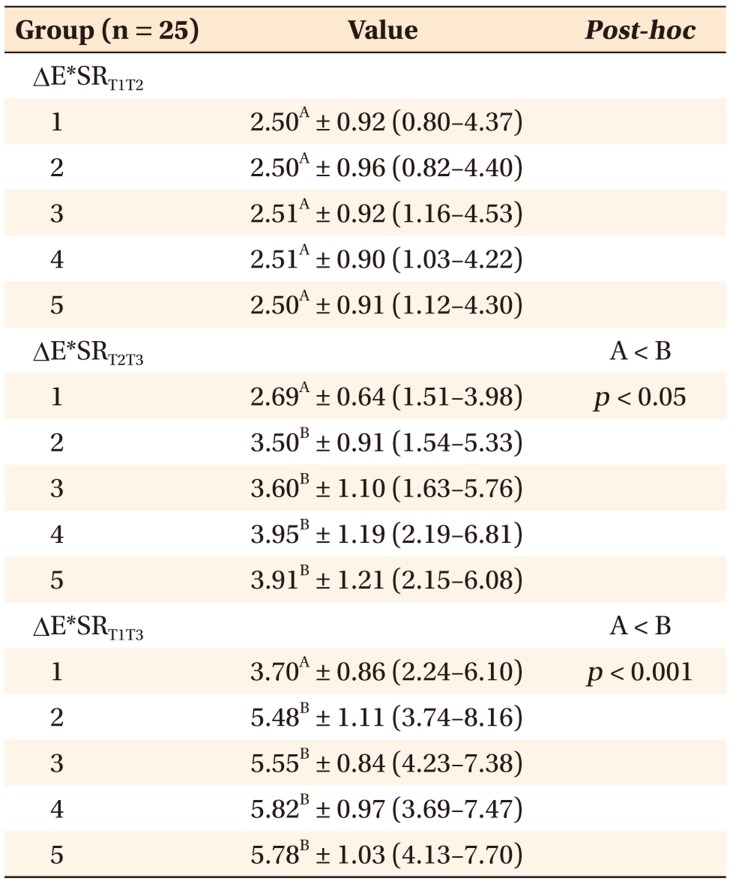
Table 1. Comparison of spectroradiometer-based color differences (ΔE*SR) between groups.
Values are presented as mean ± standard deviation (range).
Groups: 1, control; 2, home bleaching; 3, home bleaching with fluoridation; 4, in-office bleaching; 5, in-office bleaching with fluoridation.
T1, Before white spot lesion formation; T2, after white spot lesion formation; T3, after completion of external tooth bleaching.
Analysis of variance and Tukey's post-hoc test (α = 0.05).
A,BDifferent letters indicate significant differences between mean values.

