Figure 1.

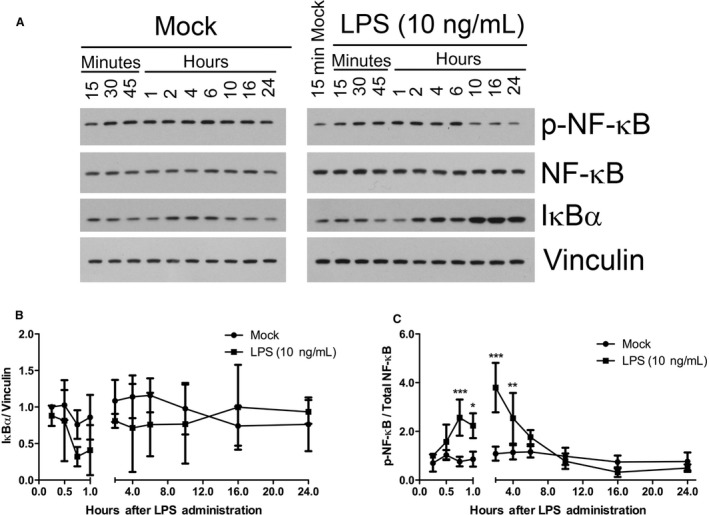
LPS stimulation of NF‐κB phosphorylation and IκBα degradation. (A) Western blot analysis of whole cell lysates for phospho‐NF‐κB, total NF‐κB, total IκBα, and Vinculin. RAW 264.7 cells were either Mock‐treated or treated with LPS (10 ng/mL) for the indicated durations. Results are representative of 4–5 independent experiments. Normalized quantification of (B) total IκBα and (C) p‐NF‐κB expression levels from Western blot films in (A). X‐ray films were scanned electronically for protein band density quantification. (*P < 0.05; **P < 0.01; ***P < 0.001; Mock‐treated versus LPS‐treated; N = 4–5).
