
Figure 6.
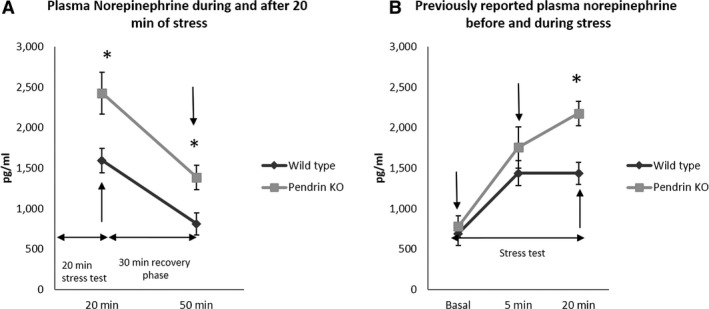
NE measurements in WT and pendrin KO mice. Panel A shows NE levels in mice after 20 min of immobilization stress and then after 30 min of relief from stress during which time they were returned to their cages and were not disturbed. Sampling points are noted with arrows. Plasma NE levels were higher in pendrin KO mice than in WT mice after 20 min of immobilization stress and remained higher 30 min after termination of stress. Wild‐type, n = 7; pendrin KO, n = 6. Groups were compared with a 2‐tailed, Student's t‐test. *P < 0.05. Panel B shows plasma NE levels published previously (Lazo‐Fernandez et al. 2015) and is shown for comparison with the new results in panel A. Blood samples were collected under basal, unstressed conditions and then after 5 and 20 min of immobilization stress (Lazo‐Fernandez et al. 2015).