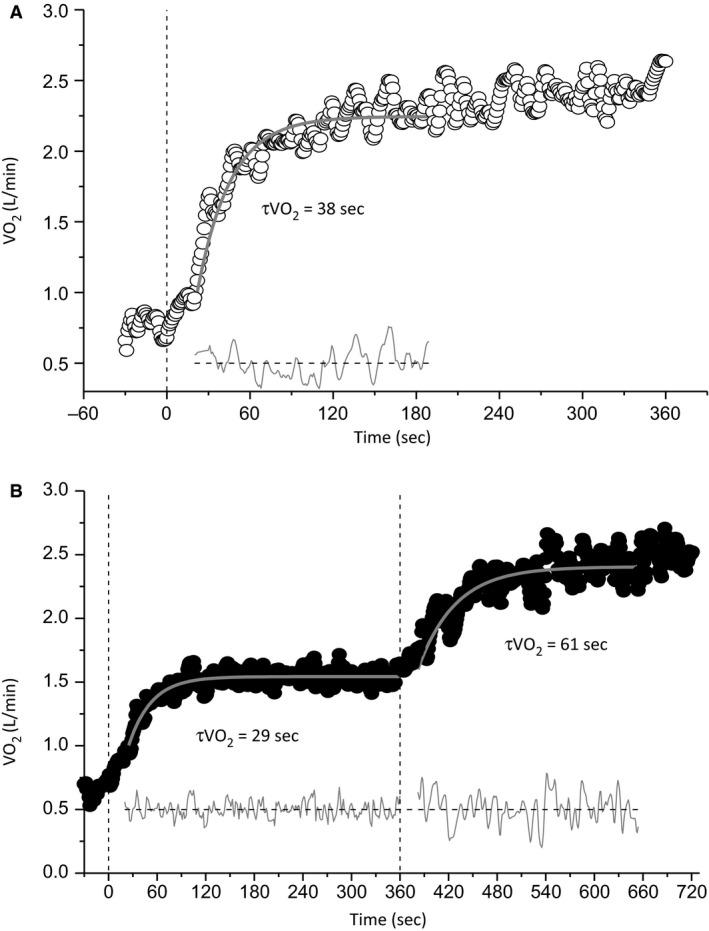
Figure 4.

Pulmonary oxygen uptake () responses and best‐fit modeled responses of a representative participant in the unloaded baseline (A; U→S) and elevated baseline (B; M→S) conditions. Vertical dashed black lines represent the onset of each step transition. values are displayed for each transition, with the thick gray lines representing the modeled fits. Lines of residuals are displayed at the bottom in gray.
