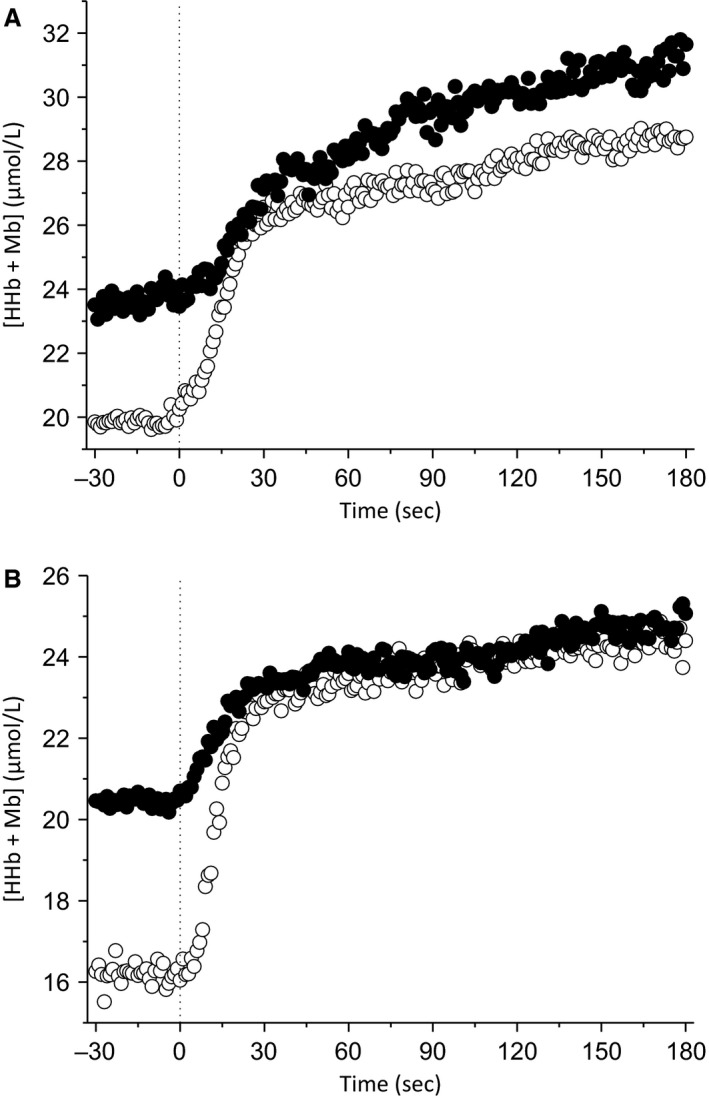
Figure 5.

Group mean muscle deoxyhemoglobin + myoglobin ([HHb + Mb]) responses and averaged modeled fits to exercise at a single work rate for both muscle sites in the unloaded baseline (open circles) and elevated baseline (black circles) conditions. Responses for the rectus femoris (RF) are displayed in (A), whereas vastus lateralis is displayed in (B). The vertical dashed black line represents the onset of exercise.
