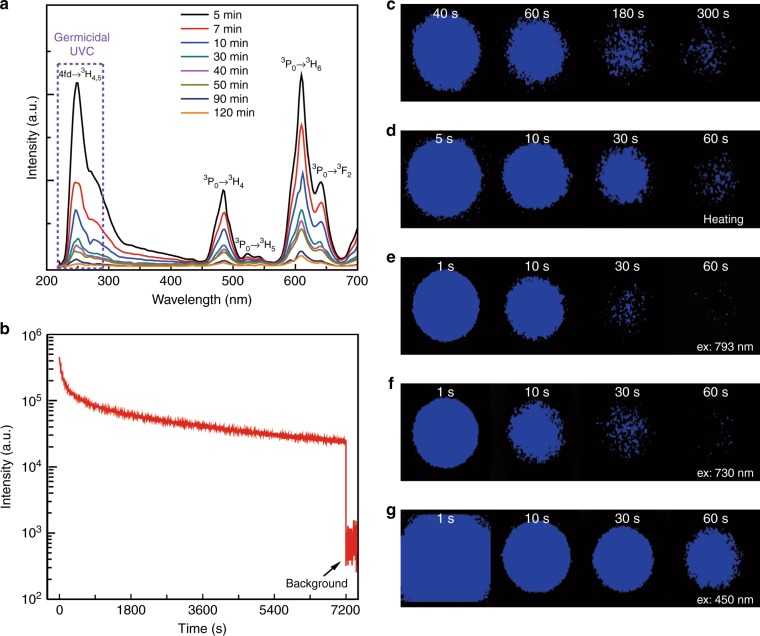
Fig. 1. UVC afterglow of Pr3+-doped fluoride elpasolite with a nominal composition of Cs2NaY0.99F6:0.01Pr3+ and X-ray irradiation for 1000 s.
a The afterglow spectra recorded at different times after ceasing X-ray irradiation. The emission band peaking at 250 nm and the emission shoulder at 270 nm can be assigned to the transitions of 4f5d → 3H4 and 4f5d → 3H5, respectively. In addition to the UVC emissions, visible emission bands were also observed. b Afterglow decay detected at 250 nm as a function of time. The data were taken from 5 min after stopping the X-ray irradiation. c UVC images of phosphors taken at different afterglow times; the images after 300 s are shown in Supplementary Fig. 10a. d UVC images of the 24-h-decayed phosphors heated to 200 °C on a hot plate. e–g UVC images of the 24-h-decayed phosphors under laser irradiation with different wavelengths of (e) 793 nm, (f) 730 nm, and (g) 450 nm. The excitation power density is 1.77 W/cm2 for the 793, 730, and 450 nm excitation wavelengths

