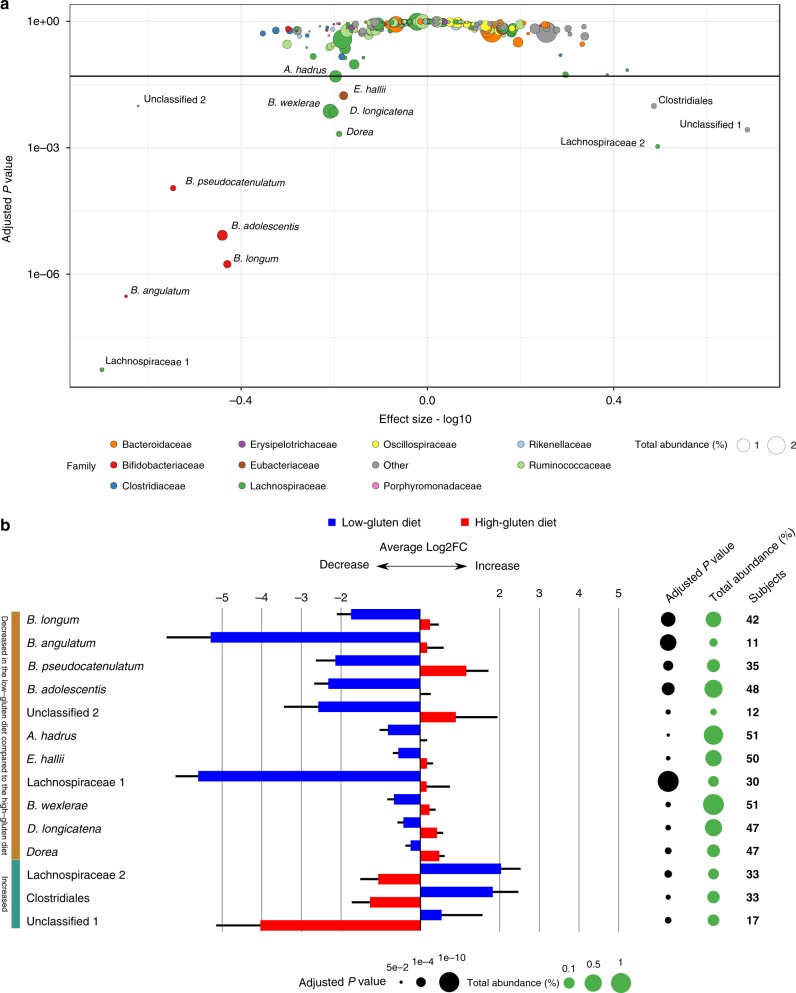
Fig. 2.
A low-gluten diet alters the composition of the gut microbiome. a Scatterplot of the statistical significance of the metagenomic species (MGSs) as assessed by a linear mixed model testing for the difference between the low-gluten and the high-gluten diets adjusted for age, gender, intestinal transit time, participant (n = 51) and carry-over effect. Adjusted P values are displayed on the y-axis (log10 scale) and the effect size (absolute values were log10 transformed) is on the x-axis. Points are sized according to the total abundance (%) and coloured according to the ten most abundant taxonomic families. The ‘Other’ category consists of the remaining families. The horizontal line represents an adjusted P value of 0.05 and the 14 species that changed significantly (FDR < 0.05) between the interventions are labelled with their full taxonomic annotation. Only species that could be annotated to family level and with abundance above 0.02% were included in the plot (255 species). b Bar chart of the 14 significant species showing the log2 fold change (means ± SEM) between baseline and after the low-gluten diet (blue bars) and high-gluten diet (red bars), respectively. The black circles are sized according to the negative log10 of the adjusted P values of comparison between the low-gluten and the high-gluten diet using a linear mixed model adjusted for age, gender, intestinal transit time, participant (n = 51) and carry-over effect. Green circles are scaled according the species abundance. The last column lists the number of participants in whom the given species were measured. Details on the individual species can be found in Supplementary Data 2

