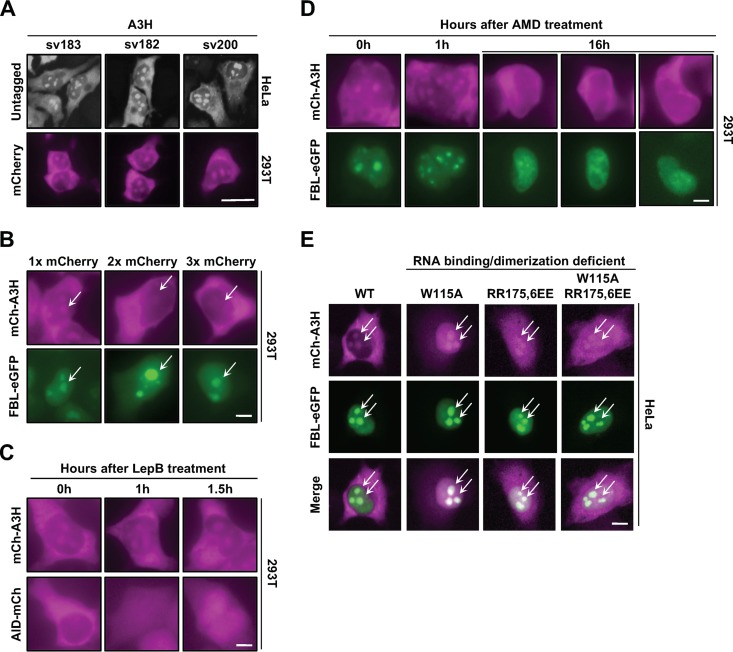
FIG 1.
Evidence for cytoplasmic and nucleolar A3H. (A) Representative images of native A3H and mCherry-tagged (mCh) splice variants. Scale bar, 10 μm. (B) Representative images of mCh-A3H with 1, 2, or 3 copies of mCherry coexpressed with fibrillarin-eGFP (FBL-eGFP). Arrows indicate regions of interest (ROI). (C and D) Representative images of a time course treatment with either leptomycin B (LepB) (40 ng/ml) (C) or actinomycin D (AMD) (0.001 ng/ml) (D). (E) Representative images of the indicated mCh-A3H constructs coexpressed with FBL-eGFP in HeLa cells. ROI are indicated by arrows. Scale bars in panels B to E, 5 μm.

